Post-sales
Are you measuring these key customer success KPIs?

Jonathan Costet
Content Author
Published on: August 3, 2022
For SaaS and subscription businesses, customer success is a key revenue driver.
Closing new contracts is important, but retaining and increasing revenue from existing accounts is crucial for maintaining and growing ARR.
So, how exactly do you measure if a customer is “successful” (and what does that even mean?)
In this article, you’ll learn how to define customer success, and discover the most important KPIs for measuring retention and growth (and other customer success goals) as well as the value buyers receive from your product.
Defining customer success metrics and KPIs
Customer success (CS) is a business initiative (and attached department) that seeks to ensure customers get maximum value out of your product.
It’s about helping buyers achieve their desired goals and outcomes, with the idea being that if this can be attained, customers will be less likely to churn.
This raises the question, then:
How on earth do you measure “success”?
For individual clients, we can ask, “What was it that the customer wanted to achieve originally? Did we reach this goal?” That’s fairly straightforward.
But measuring customer success across the board requires us to track progress and improvements in our various initiatives. In short, we’re gonna have to dive into the data.
That’s where customer success KPIs (key performance indicators) come in.
Customer success KPIs are metrics that help us to define, measure, and track progress in customer success initiatives.
Take customer churn rate (a commonly used KPI among customer success teams), for instance. If churn is decreasing and fewer customers are leaving each month, we can safely assume that our customers are reaching their objectives using our platform.
These KPIs are a proxy for success measurement, sure, but they’re crucial for understanding where the gaps are in your CS process, identifying changes and solutions, and driving recurring revenue.
If you’re wondering what impact data-backed insights can have, just look at what Gong’s clients have been able to do with their customer success efforts:
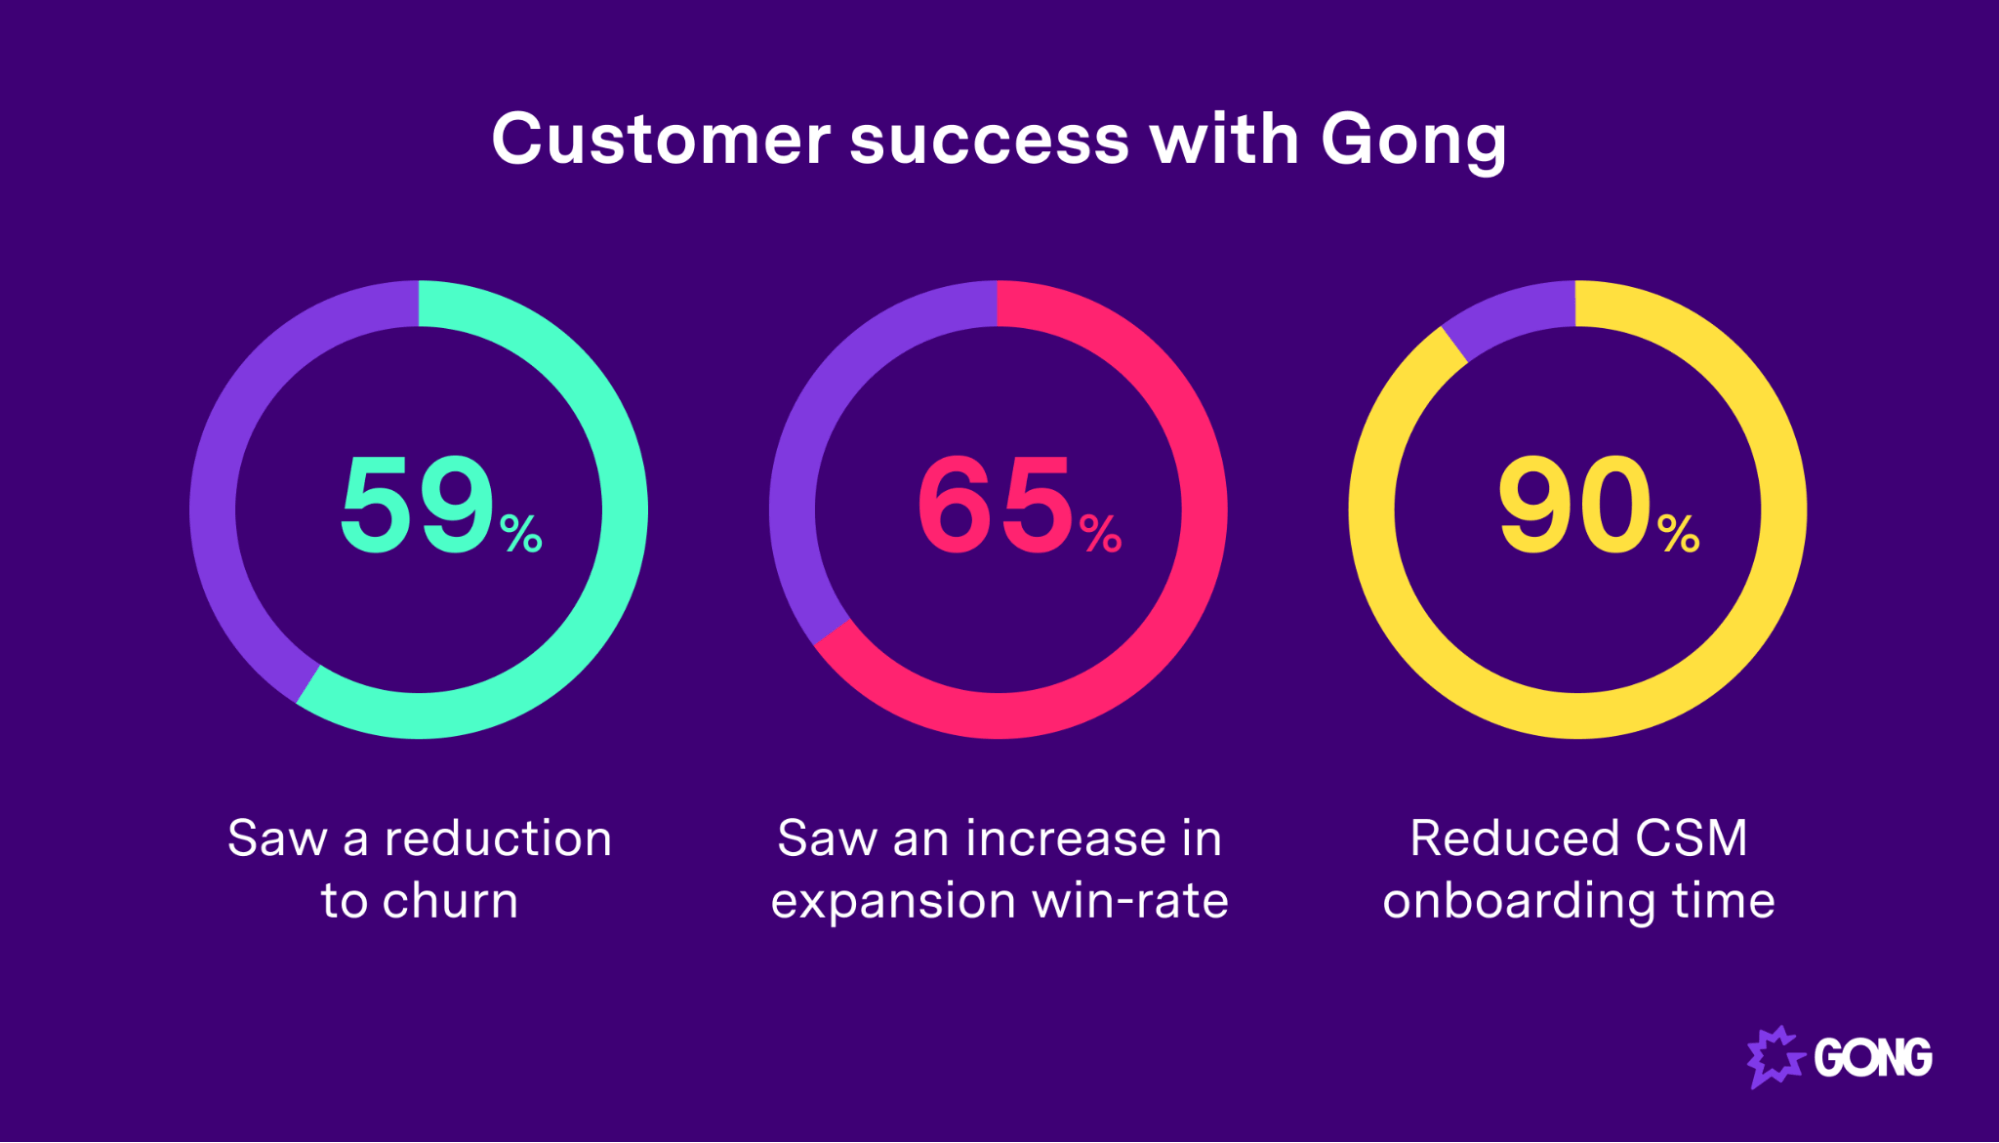
Customer success leaders use these KPIs to track engagement and inform improvements in two broad areas, each of which is a major milestone in the customer lifecycle:
- Onboarding
- Retention and expansion
Onboarding
In the first stage, success teams look at customer engagement throughout their onboarding process .
For product-led growth teams, onboarding sequences are generally automated. They’ll measure the percentage of customers whocompletethe onboarding sequence and the average time it takes for new customers to complete the onboarding sequence.
For enterprise sales, onboarding includes:
- Setting up and executing training sessions with different user groups (i.e. frontline managers, individual contributors, by department or by role)
- Collaborating with the buyer’s IT team to get licenses provisioned for all users and to set up product integrations
- Implementing a review meeting cadence (ending with QBRs every quarter to track progress)
Retention and expansion
Retention is where SaaS and subscription-based businesses make the majority of their money — customers who churn after two months aren’t driving a whole lot of revenue.
Customer success and account managers collaborate here to keep the buyer satisfied and to identify opportunities for expansion (through cross-sell and upsell conversations).
This involves identifying new needs in the organization (whether a new team or a new use case) and putting together a business case to support deploying the product further.
Customer success KPIs for measuring retention and growth
Below, we cover nine customer success KPIs tailored for tracking growth and retention:
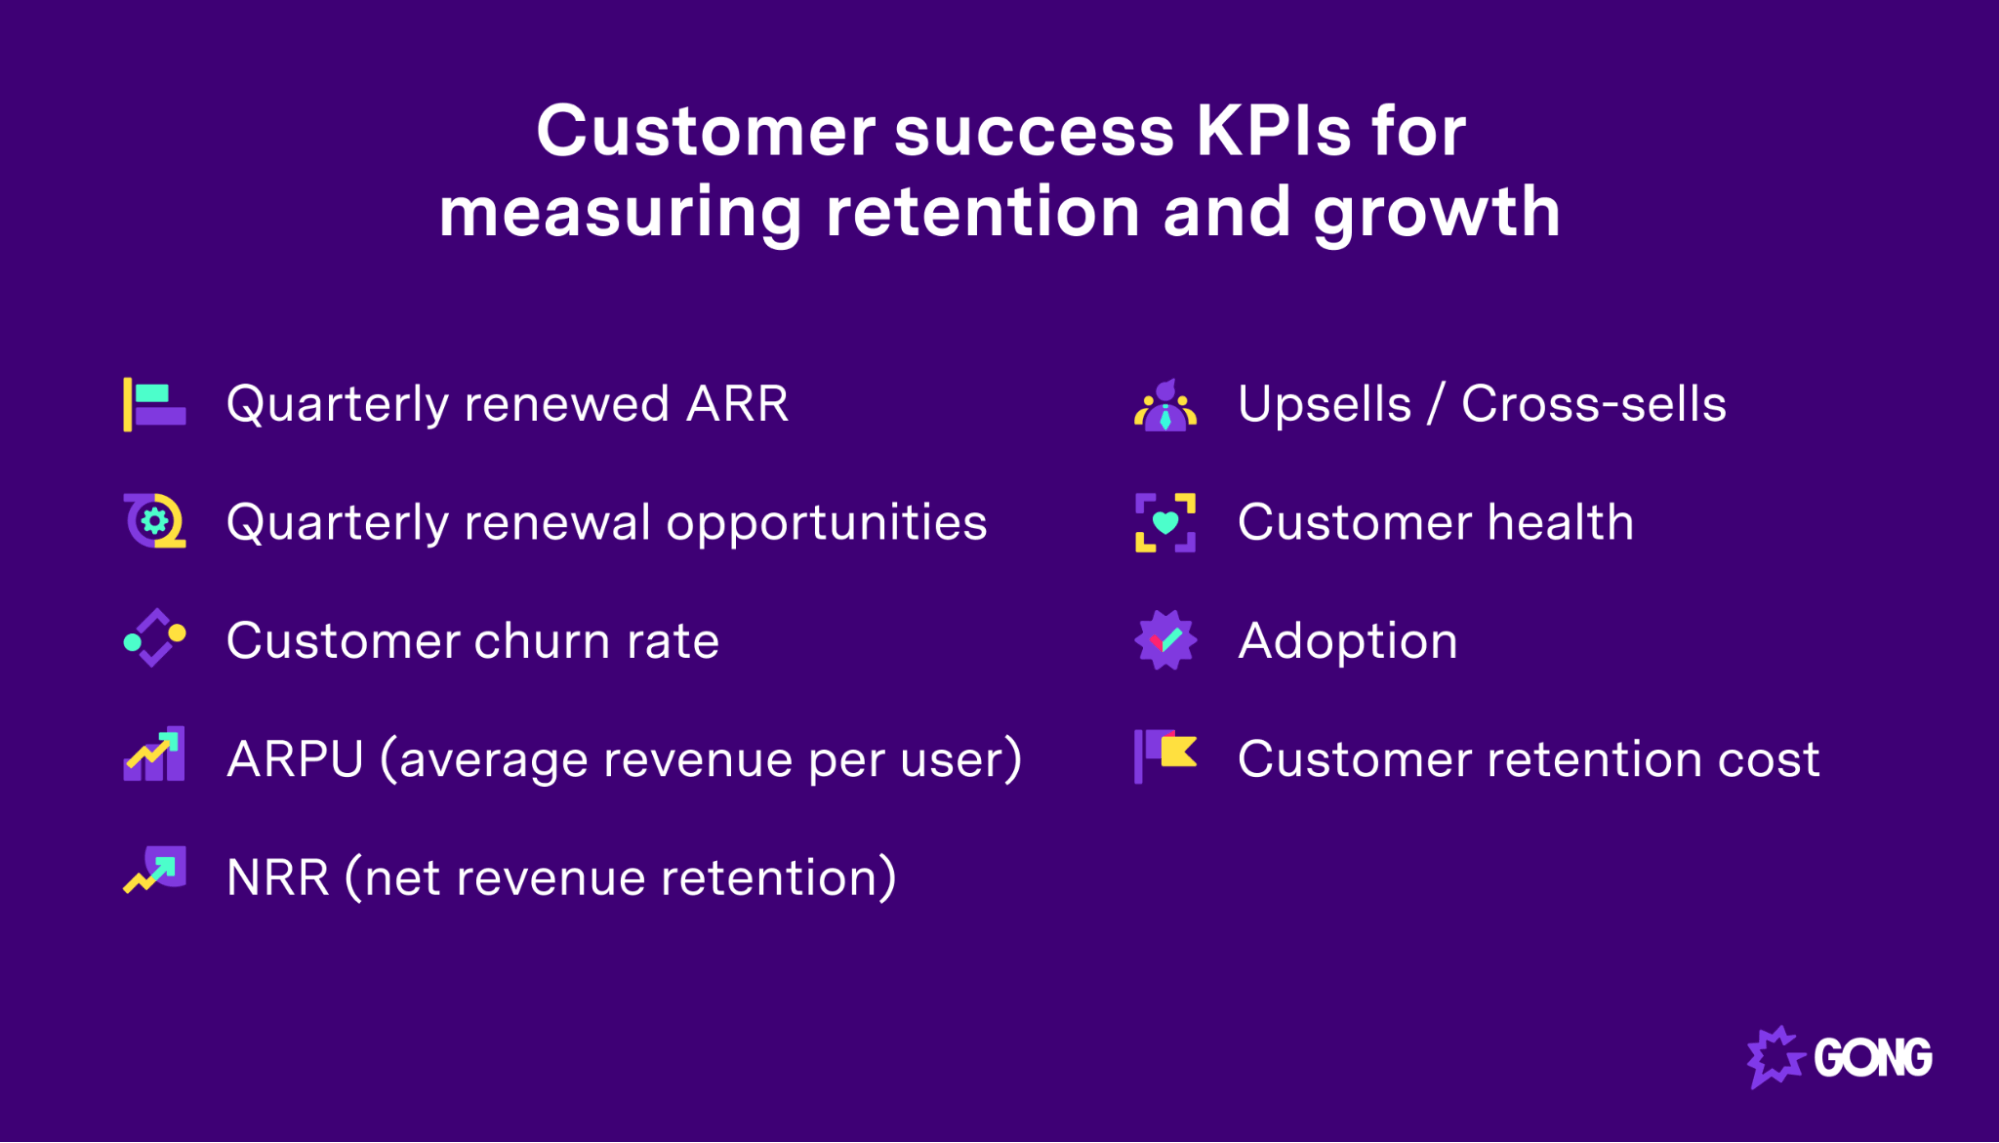
Quarterly renewed ARR
ARR ( annual recurring revenue ) is one of the most widely used metrics in SaaS and subscription revenue businesses.
Customer success managers need to look a little deeper, using the KPI “Quarterly renewed ARR.”
Your quarterly renewed ARR is the percentage of annual revenue that rolls over each quarter. In an ideal world, this would be 100%, meaning all of our existing customers continue to subscribe, and nobody churns.
Of course, we don’t live in an ideal world, so anywhere in the high 90s (e.g., 97%+) is a good place to start, but ideally, you want to hit the positive expansion numbers (101%+).
The quarterly renewed ARR formula is as follows:
(Amount of revenue renewed this quarter / Amount of revenue for last quarter) x 100
Let’s say, for example, at the beginning of quarter two, you have an ARR of $1.5m. At the start of quarter three, $1.49m of this revenue is renewed. Your calculation would look like this:
($1.49m / $1.5m) x 100 = 99.33%
Quarterly renewal opportunities
Renewal opportunities occur when a customer’s current contract comes to an end.
Say, for example, you have a two-year contract with a given client, ending in October 2023. That means you have a renewal opportunity in the fourth quarter of 2023.
Measuring quarterly renewal opportunities is important for understanding sales performance, but more important is measuring the percentage of renewal opportunities won.
To calculate:
(Number of quarterly renewal opportunities won / Total number of quarterly renewal opportunities) x 100
If you have, say, 18 renewal opportunities in a given quarter, and your success team wins 16 of them, then you can calculate it like this:
(16/18) x 100 = 88.89%
The importance of this metric is pretty straightforward: customers who are receiving value from your product and achieving their organizational goals are more likely to renew.
Customer churn rate
Your customer churn rate is the percentage of customers who canceled their subscription within a given time period (monthly, quarterly, or annually).
It’s a crucial metric as growth-oriented companies focus heavily on churn reduction . Customers who are reaching their objectives using your product (i.e., those that can be defined as “successful”) aren’t likely to leave, so high churn is an indication that improvements need to be made in the CS department.
To calculate churn rate :
(Number of lost customers / number of customers at the beginning of a period of time) x 100
So, if you have 1200 subscribers at the beginning of June, and 24 of them leave during that month:
(24 / 1200) x 100 = 2%
Generally speaking, the benchmark churn rate for SaaS businesses is between 3% and 5%, but the ideal rate for your company depends on your industry, type of product, and other factors.
ARPU (average revenue per user)
ARPU is pretty self-explanatory — it’s the amount of revenue you can expect to receive from the average user.
The ARPU formula is equally simple:
Total revenue / total number of customers
The influence of marketing and sales on ARPU is pretty obvious, but how does this KPI relate to customer success?
In the SaaS world, it’s pretty common to combine tiered and per-user pricing models.
See, for example, Toggl Track’s pricing model.

( Image Source )
With a pricing model like this, we can influence ARPU in two key ways:
- Increasing the number of users per customer
- Bringing more customers up to higher pricing tiers
Customer success has a hand to play in both. If customers are receiving great value from your product, they’re more likely to roll it out across departments and increase their users. Plus, if your product can help them grow, they’ll increase users naturally.
Secondly, if your CS team is skilled at demonstrating the value customers will receive from upgrading to a higher-tiered plan, you’ll increase ARPU.
NRR (net revenue retention)
Net revenue retention demonstrates your team’s ability to keep (and potentially grow) revenue, despite the existence of churn.
To calculate NRR, you need the following metrics already calculated:
- MRR (monthly recurring revenue) at the start of the month
- Expansion revenue
- Revenue churn
- Revenue lost to downgrades
Then, the formula is as follows:
((MRR at the start of the month + expansion revenue – revenue churn – revenue lost to downgrades) / MRR at the start of the month) x 100
NRR is a powerful customer success metric because it includes expansion and upsell revenue. That means it’s reflective of your CS team’s ability tosell into existing accounts.
If your team is exceptional at this, NRR can actually be above 100%, despite churn. That’s the goal, anyway.
Upsells and cross-sells
Upsells and cross-sells are measured as a dollar value, and they’re a reflection of your customer success team’s ability to expand revenue from existing accounts.
Revenue expansion can come from pricing tier upgrades, adding new users, or selling product add-ons.
There’s no real calculation here. You just add up the total revenue gained from upselling into each account.
Adoption
Adoption is typically measured on a feature basis.
For example, you can measure the adoption of new features by existing customers, using the following formula:
(Number of customers who’ve used the new feature / total number of existing customers) x 100
Alternatively, you can also measure the adoption of existing features by new customers, or the percentage of features adopted by each user.
As a general rule, high adoption is a signal of customer success. Conversely, low adoption can be used as a churn signal.
Customer retention cost
Customer retention cost is the amount of money you’ll need to spend (on average) to retain a customer.
The formula is pretty simple:
Total cost of customer retention / number of customers
Customer retention expenses include things like the production cost of onboarding materials, customer success agent salaries, and more.
But it can be complicated trying to figure out how much your customer retention efforts are affecting your customer lifetime values. LTV can fluctuate based on customer sources, like ads over recommendations, and many other factors, so you’ll need to make an educated guess.
Your customer retention cost should be lower than your customer acquisition cost (CAC). Otherwise, you might as well focus on new client acquisition.
In most cases, acquisition costs around 5x as much as retention, so if your CRC isn’t close to a fifth of your CAC, you may need to rethink how you approach customer success and retention.
Expansion revenue
Expansion revenue is the amount of revenue generated from selling into existing accounts. To calculate expansion revenue, simply remove existing revenue and revenue from new customers:
MRR at end of month – MRR at beginning of month – revenue from new customers = expansion revenue
Say, for example, at the beginning of the quarter, you’re making $1.5m in MRR.
At the end of the quarter, you’ve increased this to $1.8m, $200,000 of which came from closing new customers. Using the formula above, you can calculate that the other $100,000 came from expansion, through wins such as:
- Selling new product add-ons
- Increasing the number of users per customer
- Upgrading some customers to higher pricing tiers
Customer success KPIs for measuring engagement and relationships
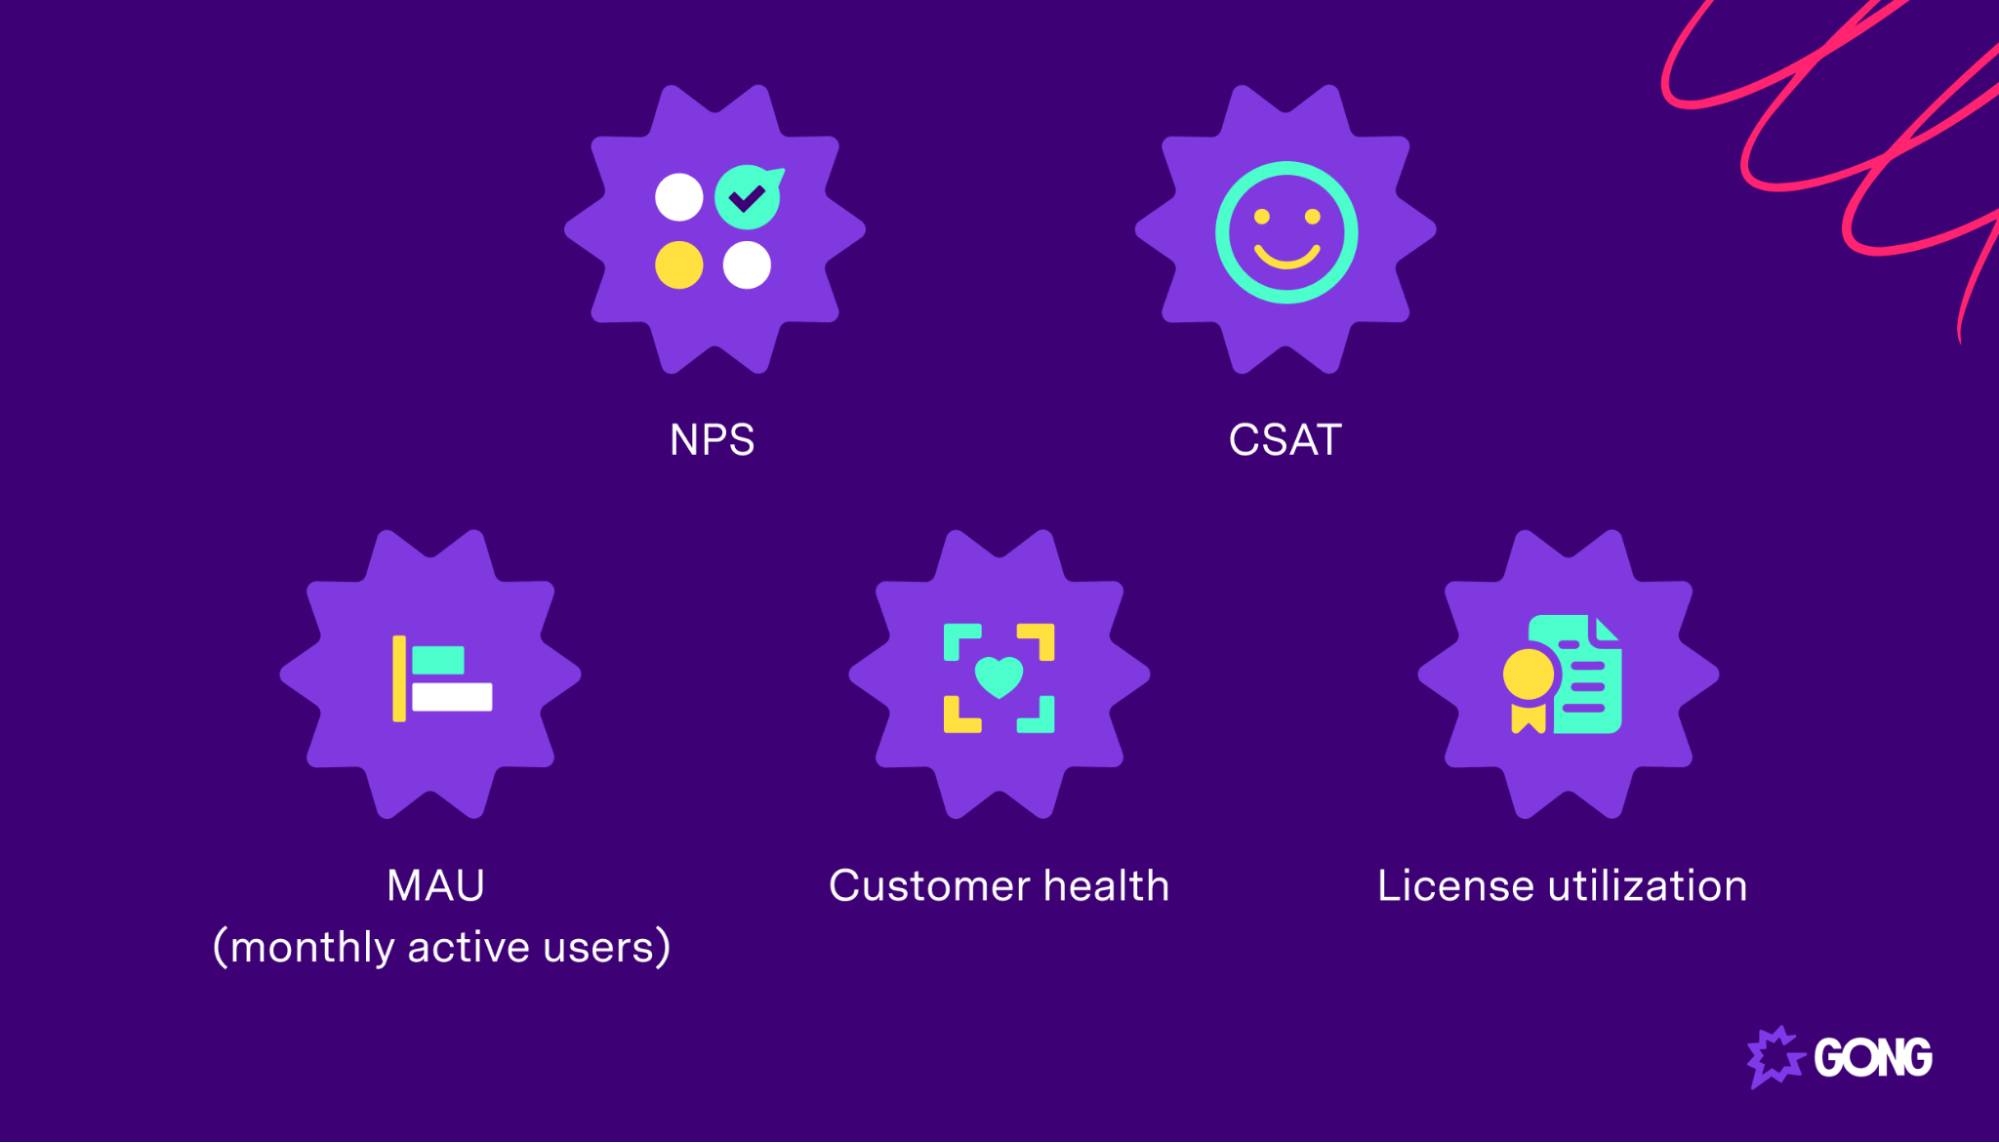
Next up, let’s explore some customer success KPIs you can use to measure the health of your customer relationships.
NPS
Net promoter score (NPS) is widely considered the holy grail of customer success metrics.
It’s a simple process: you ask customers one question (“On a scale of 1-10, how likely would you be to recommend us to friends or colleagues?”) and then allocate respondents into three groups:
- Promoters (those who scored you 9 or 10)
- Passives (those who scored you 7 or 8)
- Detractors (those who scored you 6 or below)
Then, you apply the NPS calculation:
Percentage of promoters – Percentage of detractors
Success teams use NPS to understand customer sentiment and likelihood to churn. Generally speaking, scores between 30 and 70 are considered desirable.
License utilization
License utilization is a good indicator of customer engagement, and it’s pretty easy to calculate:
Number of active users / number of total users sold x 100
Let’s say, for instance, you’ve sold a customer a plan with 100 users. However, only 80 of those users have actually logged on in the last month. You have a license utilization rate of 80%.
We want license utilization to be as close to 100% as possible. If some users aren’t utilizing their subscription, your customer is less likely to see value in your product and more likely to churn.
CSAT
CSAT (customer satisfaction) is another metric that you can use as an indicator of engagement and overall customer happiness.
To calculate CSAT, you first need to run some form of customer satisfaction survey. This can be a simple “How did we do?” asking buyers to rank you on a scale of 1-10.
Then, we calculate:
(Number of satisfied customers [those who scored 9 or 10] / Total number of respondents) x 100
CSAT can be used to measure success at different stages in the customer experience, based on when you distribute the survey. For instance, a CSAT survey delivered directly after a purchase is helpful for understanding how buyers feel about the purchase process.
Customer health
Customer health scores differ by organization, meaning how you calculate this metric will depend on the signals you identify that demonstrate customer success.
For instance, you might look at three signals for measuring customer health:
- Frequency of usage (how often a customer logs in)
- Breadth of usage (the number of users a customer has)
- Depth of usage (the number of features a given customer uses)
Then, you’assign values to each signal (perhaps using a scale of 1 to 10). For example, customers who use your product daily might score 10, while those who log in less than once per month score 1.
In this example, you’measure your customer health score out of 30, and then average that across your entire customer base.
MAU (monthly active users)
Monthly active users is a great customer engagement metric for subscription software companies.
MAU tells you how many of your paying customers actually log in and use your product every month. Low MAU numbers are a sign that your product isn’t engaging, is complicated to understand, or that your onboarding sequence needs work.
Level up your customer success metrics and kpis with Gong
Customer success KPIs are crucial for measuring progress towards CS goals, influencing retention, and ultimately driving recurring revenue.
Of course, KPIs can’t be viewed in a vacuum — you’ll need to implement changes, review and analyze specific customer stories, and put a coaching and development practice in place for your customer success employees.
Wanna learn how?
Momentive used Gong to develop a comprehensive customer success coaching program and drive engagement and retention.
Get all the secrets and level up your customer success initiatives here .

Content Author
Jonathan Costet is the Senior Director of Revenue Marketing at Wiz. Before this, he was Senior Manager, Growth Marketing at Gong, where he played a crucial role in driving demand generation through data-driven strategies. At Gong, Jonathan harnessed the power of revenue intelligence to craft effective messaging, improve customer retention, and optimize sales forecasting. He was instrumental in using Gong's platform to unlock insights that helped target the right buyers and maximize marketing efficiency.
Discover more from Gong
Check out the latest product information, executive insights, and selling tips and tricks, all on the Gong blog.
