The ultimate guide on churn analysis and customer loyalty
New customers are wonderful, but recurring customers are what keep a business afloat, especially for SaaS and other service companies. That’s why it’s critical to keep retention levels steady. As such, we have to understand both why clients return (or stay subscribed) and why some don’t.
That’s why it’s important to analyze customer churn. By understanding who’s churning, when they’re churning, and why they’re abandoning your product, you can make changes that will appeal to your target audience and lower churn before it grows out of control.
But what exactly is customer churn? Why is analyzing it so crucial to continued business growth and success? How does one calculate customer churn? And how can the results of your churn analysis help you improve your business?
We’re going to discuss all of this and more in this article.
What is customer churn and why is churn analysis so important?
Simply put, customer churn is the number of customers leaving your product or service. For a SaaS company, that’s customers who decide not to renew their service subscription after an initial term or other measurable time period.
A strong understanding of customer churn is crucial for any business because it helps you manage customer retention. But why should you focus on retaining customers? Shouldn’t your attention and budget be on bringing in new customers?
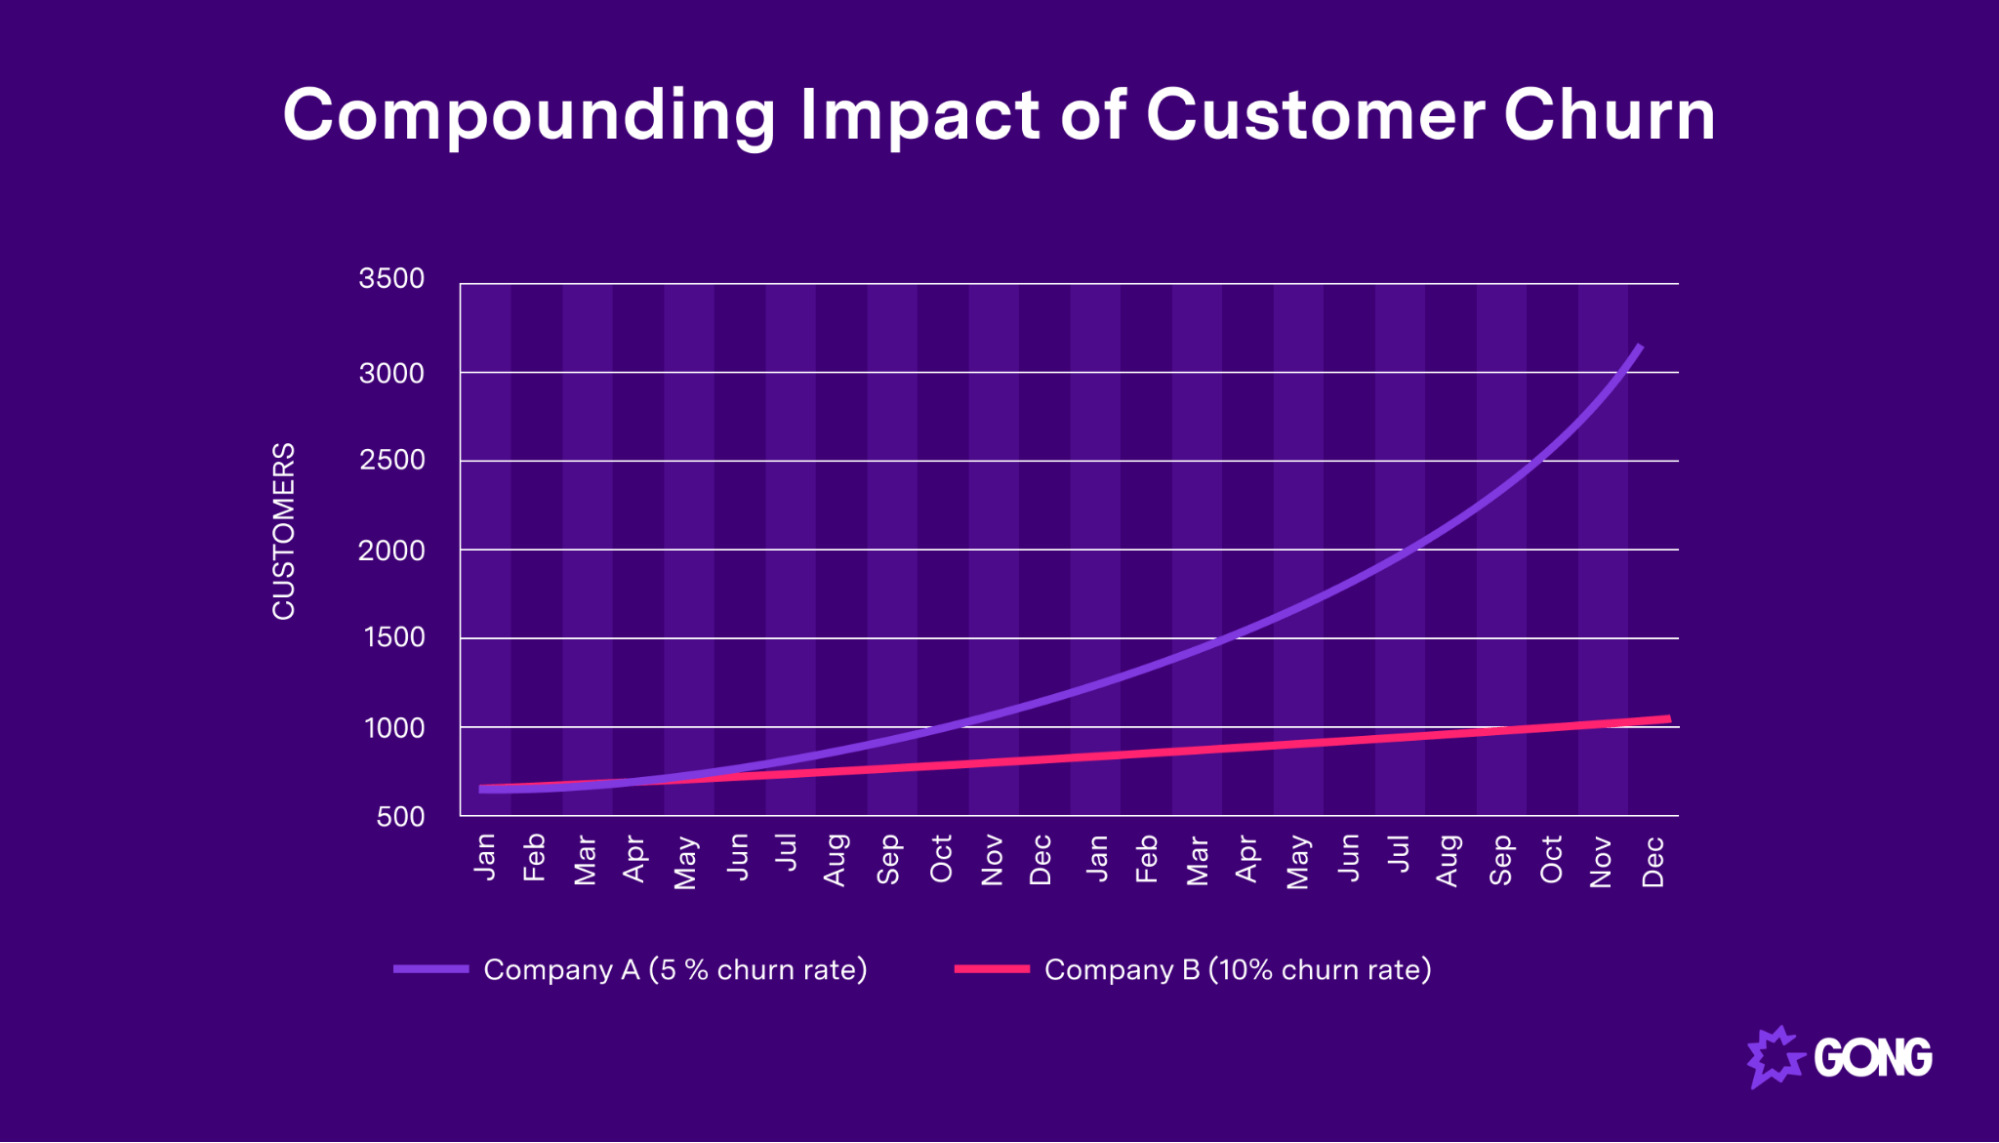
Sure, bringing in a brand new client is 100% new revenue, but it doesn’t have the same compounding effect as customer retention. Every percentage point you can bring churn down has massive implications for future revenue growth.
For example, if they both acquire new customers at the same rate of 15%, a company with a 5% churn rate will outgrow a company with a 10% churn rate by over 500% in just two years.

Analyzing customer churn can provide you with some much-needed insight into essential business metrics, allowing you to identify issues that lead to clients leaving early or not renewing contracts.
Some important indicators for SaaS companies would be low NDR (net dollar retention) or GRR (gross retention rates). Analyzing recurring revenue from existing customers shows opportunities for revenue growth and helps establish a company’s valuation. If your NRR falls below 100%, you must figure out why immediately, and maintaining your GRR is essential for maintaining or growing your company’s market share.
As you investigate high churn levels, you might identify issues with vital customer-facing components of your business, like poor customer service. If you note that customers are churning because of issues with your support system, you can get out in front of that issue and rectify it before it becomes a huge problem.
By examining churn regularly and catching these issues early, you can actually prevent revenue loss before it happens.
That’s why people use churn analysis tools to examine where they’re losing people so that corrective actions can be taken.
How to perform a customer churn analysis
Now that you have a strong understanding of why customer churn analysis is so vital, we have to go through the various ways you can look at your churn rate and figure out what needs to be fixed.
Determine your churn rate period(s)
Before doing anything, you obviously have to determine your actual churn rate for a specific period.
When calculating churn, you first have to figure out what time period you’re going to examine. This could be a month, a quarter, six months, or even a whole year (monthly and annual being the most common period choices).
To identify different patterns and underlying causes, you should also calculate churn for various periods. If you notice high annual churn rates, break it down by quarters and months to figure out when the bulk of your customers left.
Calculate your churn rate
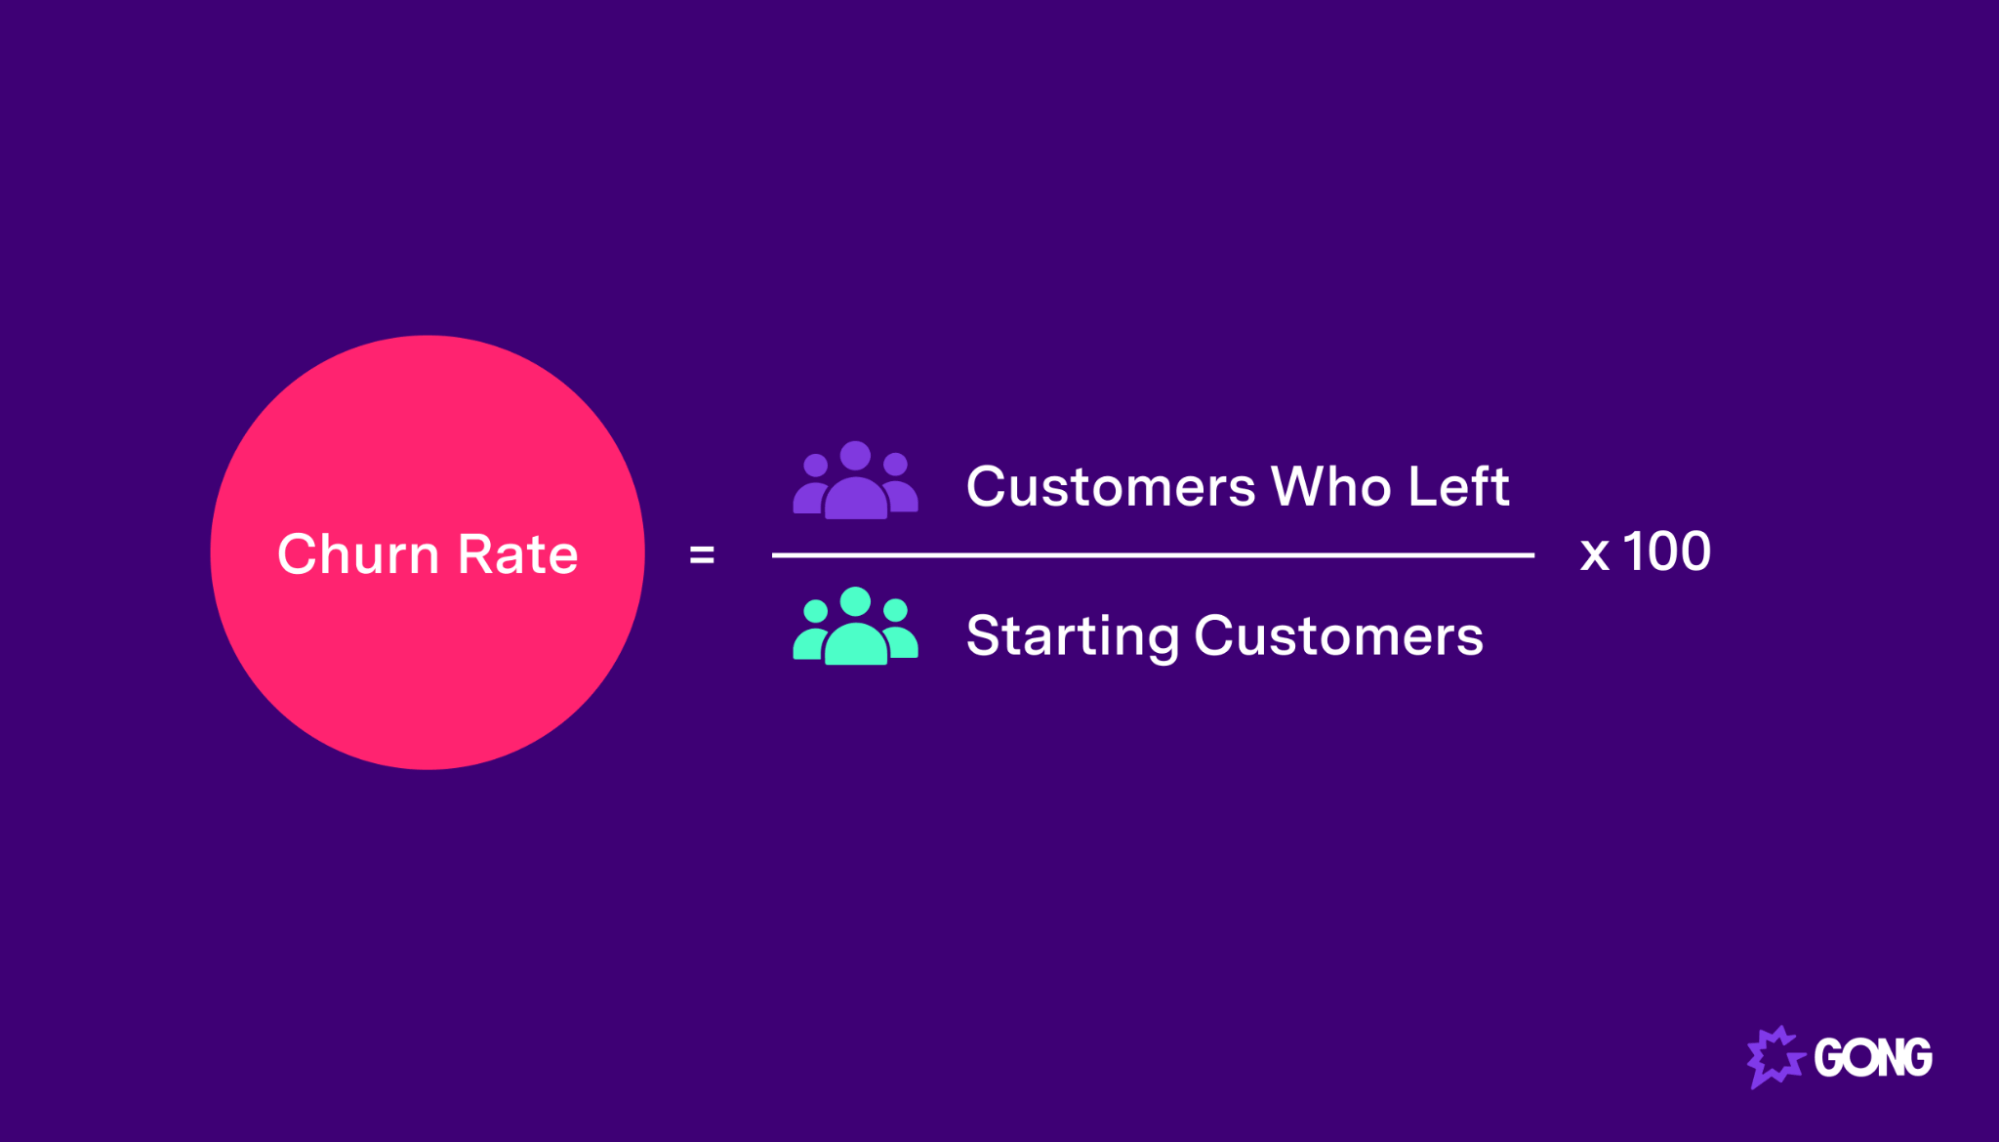
Once you know what period you’re looking at, determine how many customers you had at the beginning and how many were left at the end. Subtract the ending figure from the original, and you’ll see how many customers you lost.
For example, if you started the period with 12,000 customers and ended with 10,000, then 12,000 – 10,000 = 2,000 customers lost.
Then, divide that number of lost customers by your original starting number. In the case of our example above, you’d do 2,000/12,000, which gives us roughly 0.17. Next, multiply that result by 100, and you’ll get your churn rate percentage.

In the case of this example, 0.17 x 100 = 17. That means your churn rate calculation for that period was 17%.
Monitor relevant KPIs (key performance indicators)
Once you know that churn rate, it’s time to monitor relevant KPIs and metrics for that period. For example, did customer engagement rates go up or down? What about product usage? Did you receive more support requests during that time?
Some key metrics you might want to consider include:
- Activation rate: percentage of the licenses the company pays for that actually get used.
- DAU/MAU rates: the percentage of all users that are active on a daily basis (DAU), or monthly basis (MAU).
- Net Promoter Score (NPS): a survey-based metric that indicates client sentiment towards your product (more on how to measure this in the next section).
After gathering information on both your churn rate and engagement KPIs, you can look deeper to find out why some of your loyal customers churned.
Send out customer surveys
One approach you can take to analyzing customer churn is qualitative: get individual clients to tell you more about how they feel about your product, and churning clients to tell you why.
One way to do this is to send surveys to churned customers and ask them why they canceled. You can also send NPS surveys to current customers to gauge their happiness.
Look for common issues in the responses to determine where you have holes in your customer experience. Learning why these people churned will not only allow you to fix issues for your remaining customers, but you can also retarget these people by correcting problems that drove them away.
When large or VIP accounts send you notice of cancellation or non-renewal, you can set up an exit call or meeting to find out why they’re leaving and ask for feedback. Again, not only are you getting valuable insight into the customer experience, but you also have an opportunity to save the customer relationship.
For example, if they’re leaving because of pricing or a lack of immediate need for the product, offer to let them pause for a few months or provide a discount. If they’re leaving because they’re having difficulty with product adoption and getting their team to use the platform, offer to help them with onboarding and training.
Determine what issues to address and reduce churn
If you find common issues among your churning clients, many of your other clients may be facing the same problems; they just haven’t churned yet. That means you can determine which accounts are at risk and get in front of potential churn.
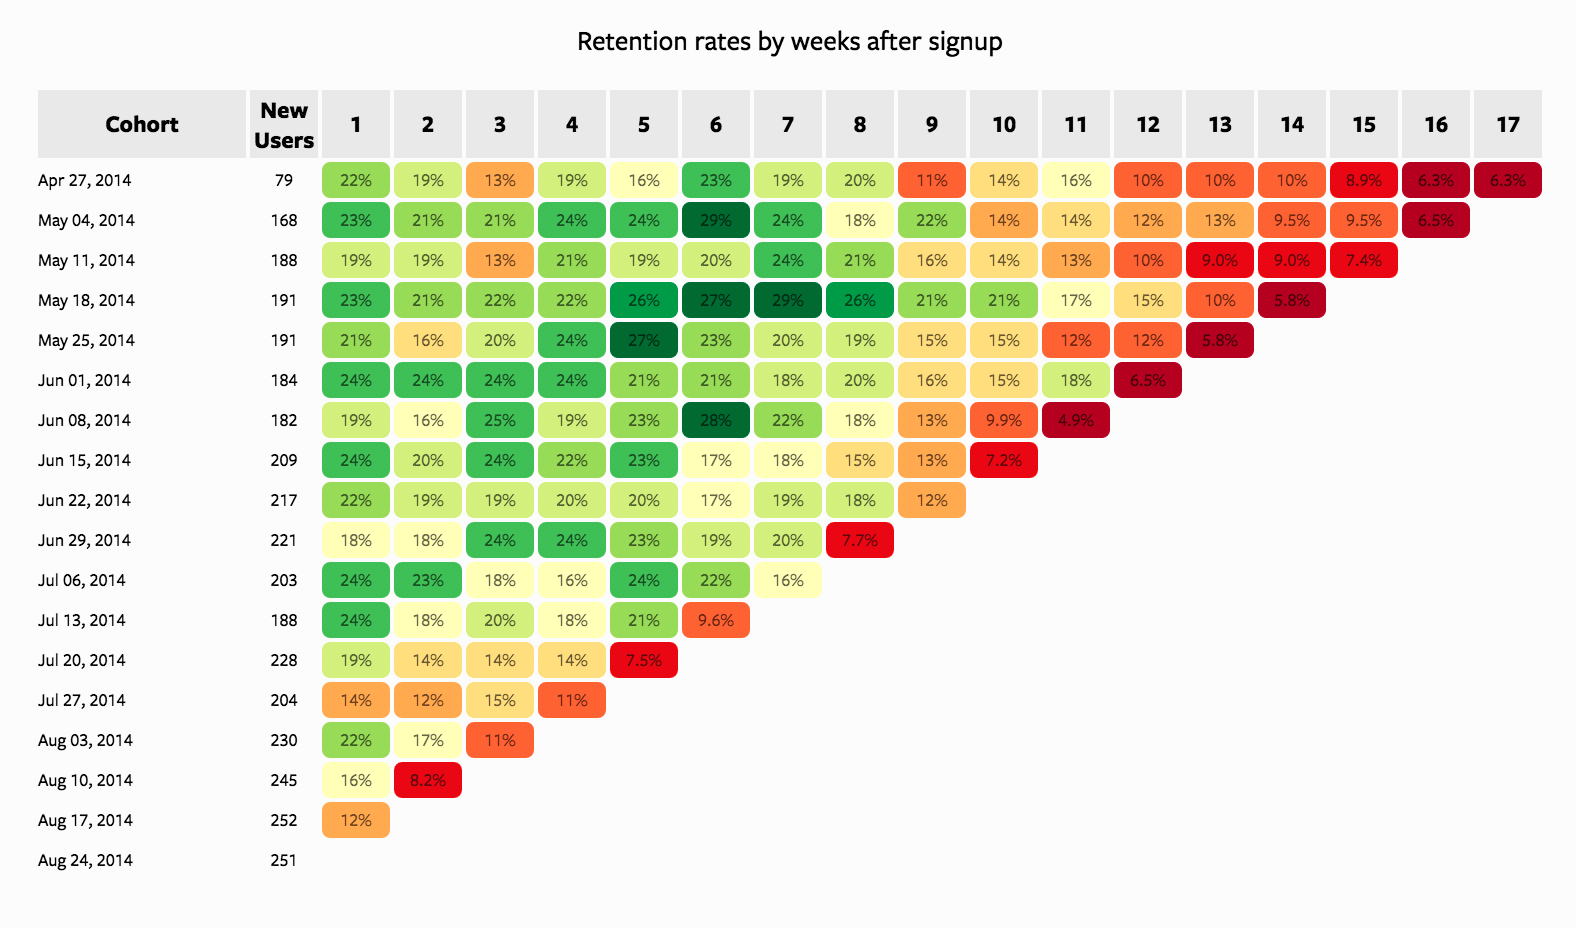
It’s also a great idea to perform cohort analysis, differentiating between issues that arise for newer customers vs. those who have been with you for years. This is a more quantitative approach to analyzing churn.
In cohort analysis, you segment your clients by different vectors, for example, sign-up dates, and compare retention rates over the weeks, months, or years after they signed up.

You can also break groups up by company size, referral source, and other factors that might help you identify patterns in your churn.
By understanding every step of the customer journey, you can more accurately focus on churn reduction for all of your customers and prevent any future large-scale revenue loss.
How to perform a customer churn analysis
After analyzing your churn results, you have the data you need to start tackling the issue. But you need to know what to do with it before you can start transforming your retention rates.
Here are four ways that you can use your churn analysis data to boost your bottom line.
Identify specific issues
If your churn rate is higher than expected, something is wrong with your business. There’s something off in your customer journey — some deficiency that’s driving customers away into the waiting arms of your competitors.
First, use the churn data to narrow down when people are churning. Once you have that information, look at the customer journey and start polling customers who’ve churned. As we mentioned in the last section, this is also a great time to schedule exit interviews.
Then, you want to confirm your suspicions by comparing different groups using cohort analysis (for example, customers with an unanswered support ticket vs. customers who had all their tickets answered).
Identifying these issues is the first step toward fixing them. Once you have figured out what’s pushing people away, you can fix the holes in your customer journey and ensure that this momentary jump in churn doesn’t become a mass exodus that leads to a serious loss of revenue.
Determine what your customers want (and don’t want)
By looking at your churn data, you can see how customers interact with your business. This includes how they react to the various actions you’ve taken, such as messaging, promotion, support initiatives, and more.
When you roll out new pricing models or any operational changes, you can use churn rate analysis to determine whether it landed well with your audience or pushed them away.
If your churn rate goes up, it may have been a bad course of action, and you might be better off rolling back the changes. If churn goes down, or at least net revenue retention goes up, then it was a good move that positively contributed to the continued profitability of your business.
You can then use this data to inform your marketing strategies going forward. You’ll also be able to use your audience’s likes and dislikes to your advantage when designing improvements to the customer experience.
Improve customer support
Strong customer service is absolutely crucial for any business that wants to grow long term. This is especially true for SaaS organizations that have to deal with customer education, outages, and more technical issues than your standard ecommerce shop.
Many issues that could lead to churn can be resolved through helpful customer support interactions.
A massive 81% of consumers say that a positive customer support interaction will help them decide whether they will return to a business for another purchase.

If you have a high churn rate, it doesn’t necessarily mean that your customer support is bad. But by analyzing support tickets, you can get a good view of customer issues.
For example, what are the chief complaints that are coming through? Are a large percentage of your support calls related to a specific feature? Is there something unclear in your user interface that’s causing confusion? Are your educational resources not doing enough to inform your customers? Are your support representatives doing their best to fix these issues and provide quality service? Are competitors underbidding your main offerings and stealing customers away?
If you’re not analyzing churn information and comparing it with your support interactions, you’re leaving many potential solutions on the table.
Accurately predict future churn
Finally, you can use churn rate analysis to accurately predict future churn rates and customer attrition, especially after examining this information year after year. This will help you figure out if you have a slow season and identify regular peaks and valleys that occur at specific times.
For example, you may find that your churn rate goes down after tax season every year. If you know that, you can bank on increased revenue during that period. Accurately predicting future churn also makes alarming changes to your churn rate more evident.
If you’re expecting a huge churn dropoff in the second quarter based on historical data, but then you see your churn rate skyrocket, you can instantly tell something is wrong. These variances will stick out like a sore thumb, allowing you to launch an investigation right away and determine what’s changed with your customers, your product, or the market in general.
But basic revenue metrics alone aren’t great for predicting churn in specific accounts, for example, your biggest VIP clients.
You can use Gong to help accomplish this. Our platform can analyze patterns through communication frequency, topics, and more. Using Gong, you’ll even be able to flag any customers up for renewal and determine if they’re being affected by issues that made previous customers churn. You can then identify this potential future churn and address those issues to get out in front of a possible loss before it becomes a problem.
Level up your customer churn analysis with Gong
Churn analysis is crucial if you have ambitious growth goals for your company. By identifying and analyzing periods of high customer churn, you can identify issues within your business, determine what customers like and don’t like, improve customer support departments, and accurately predict future churn to identify major variances.
Gong can be an effective tool in your quest to fix issues that lead to churn and to help increase customer retention and profits for years to come. Contact us today for more on how Gong’s customer retention management software can revolutionize your sales and retention processes.

