A guide to building effective and accurate sales pipeline reports
Excellent pipeline visibility can make sales managers feel like superheroes. It’s easy to swoop in and save the day when you can see which deals are at risk of stagnating. Being able to instantly tell executives the exact number and value of sales in your pipeline is like having spidey senses.
Unfortunately, that’s not the case for most sales managers. A lack of visibility makes it hard to track deals, report to executives, and optimize the sales process.
But if you’re struggling to see clearly into your pipeline, you don’t need a superpower to help. You need pipeline reporting. A sales pipeline report paints a clear picture of your sales pipeline, helping you to understand what’s happening and take action to improve it.
In this guide, we’ll explain what pipeline reporting is, why you need it, and how to create your own killer pipeline report.
What can a sales pipeline report tell me?
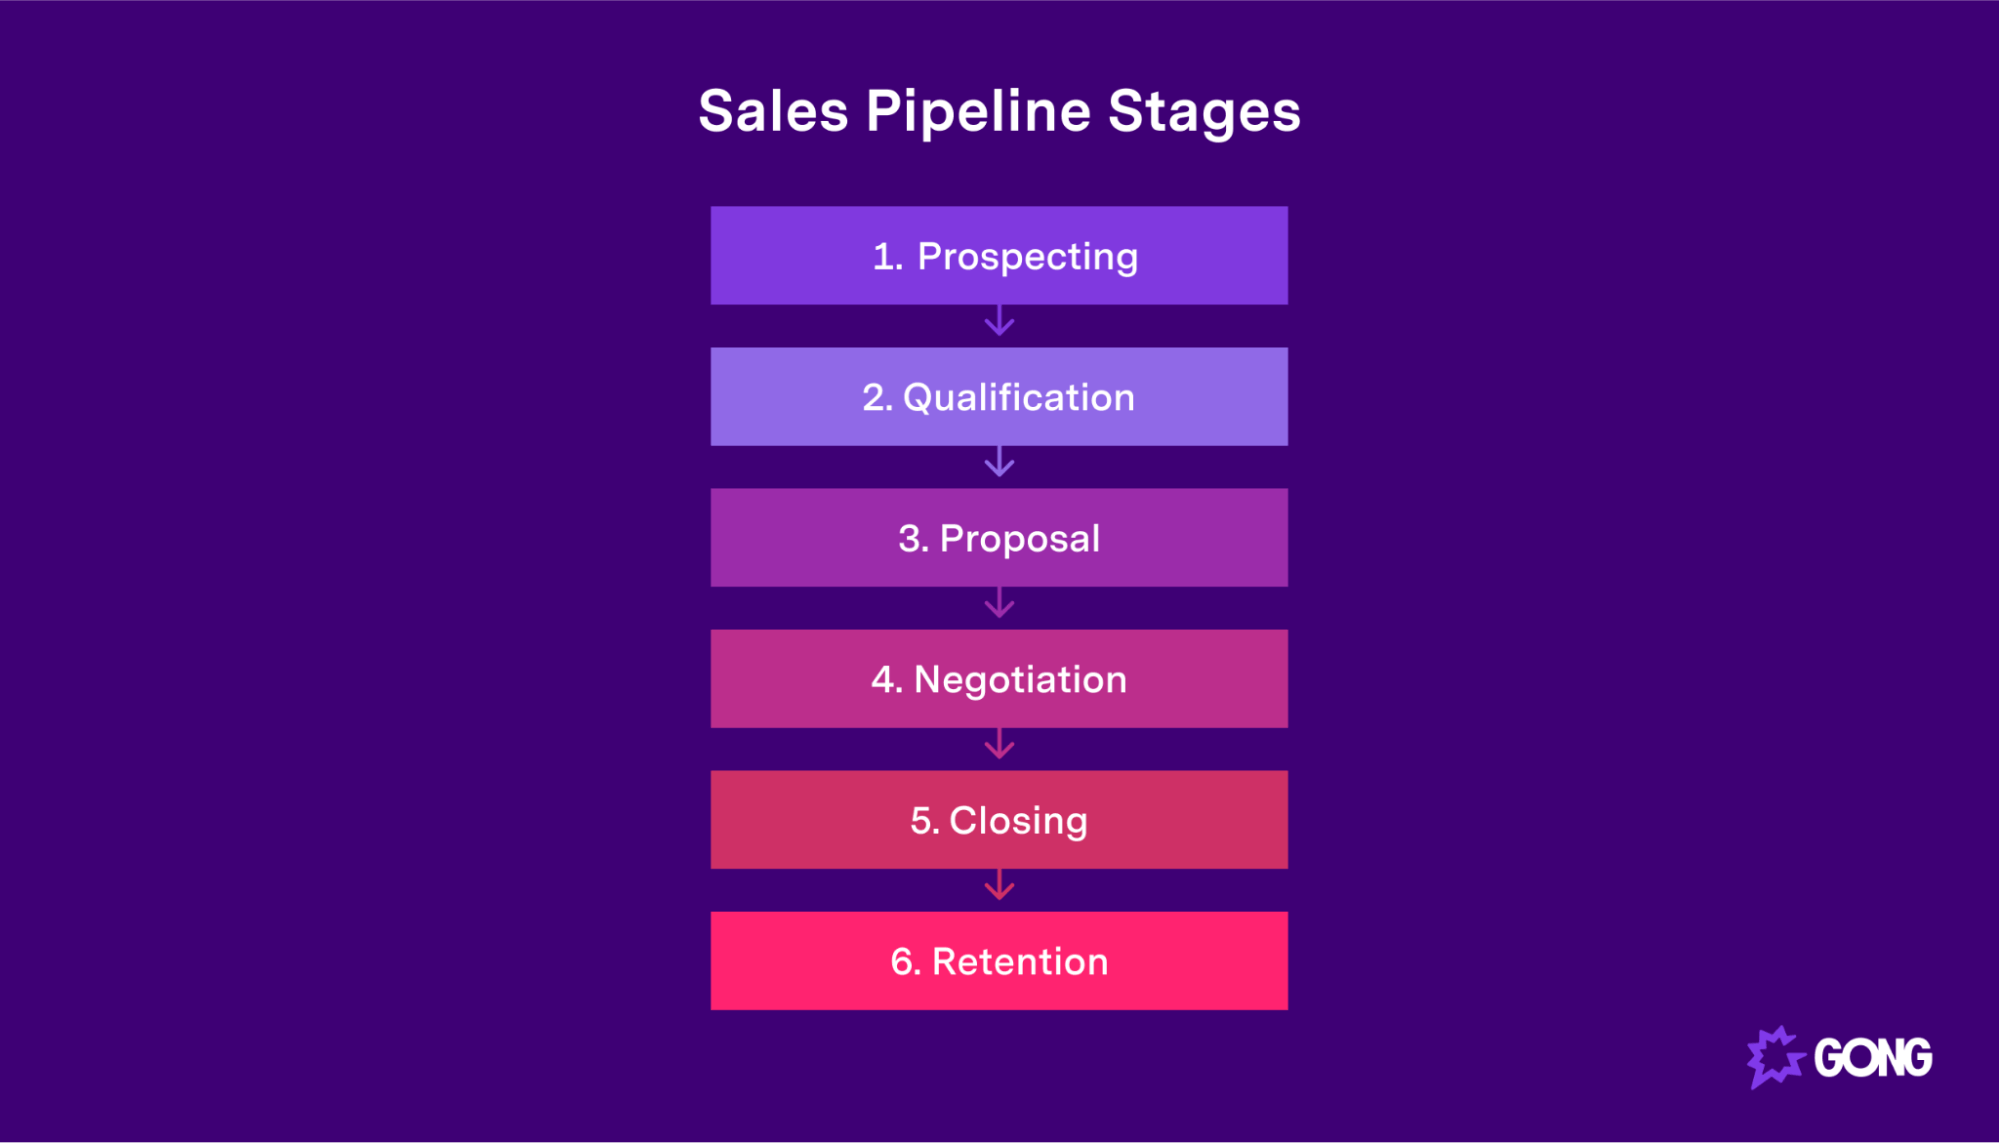
A sales pipeline is a representation of your sales process. It’s the exact steps your reps must go through to turn prospects from leads into deals. You can see an example of a typical sales pipeline below.

A sales pipeline report is an analysis of all of the deals currently in your pipeline. It shows you the stage and value of each deal, the total value of your pipeline, and a selection of essential pipeline metrics (which we’ll discuss in more detail below).
A sales pipeline report is not the same as a sales forecast. It is an overview of your pipeline as it currently stands — the here and now. A sales forecast, on the other hand, is an estimate of what your pipeline will look like in the future. It predicts which deals will close in a given timeframe and how much revenue those deals will generate.
Why create a pipeline report?
Pipeline reports are incredibly useful and versatile tools. Here are four key reasons sales managers should create them:
They make it easy to report to executives
Every sales manager wants to look good to their superiors. One of the best ways they can do that is to know what’s happening in the pipeline at any given time. For that, pipeline reports are one of the best sales reports you can create.
Sales pipeline reports make it easy to report to executives on the health of the pipeline and show the potential value of deals that may close soon. This makes them an excellent addition to sales forecast reports, allowing executives to understand how the pipeline looks in the present as well as how it may look in the future.
They help you understand your sales process
While you can always delve into your CRM to see the progression of the deals your sales team is working on, it’s much easier to create a sales pipeline report.
A sales pipeline report will give you a bird’s-eye view of your sales process, helping you to understand how many deals are at which stage of your pipeline and identify any potential bottlenecks and at-risk deals.
As a result, you can use a pipeline report to optimize your sales process. For example, bottlenecks may show lead quality issues, especially if you are struggling to close them. A pipeline report can also highlight problems with individual sales reps.
They improve team performance monitoring
Speaking of sales reps, pipeline reports are a great way to analyze your sales team’s performance and take steps to improve it.
Specifically, they can help you to identify your team’s top performers and the areas of the pipeline that others struggle with.
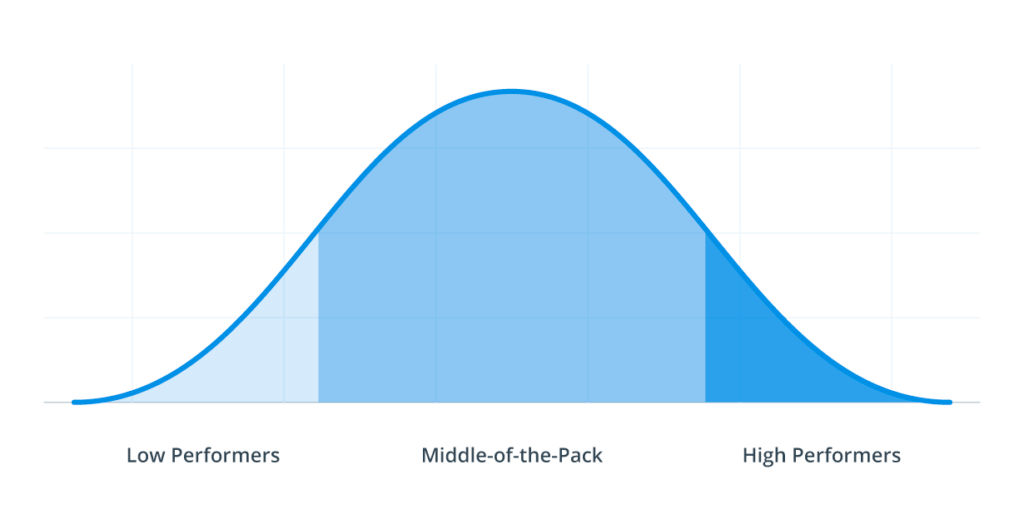
You may already know this, but there’s a gap between your top reps and your middle and low performers — and a pipeline report is just the tool to help you close it.

The trick is to understand what your high performers are doing to move leads through your pipeline that low performers aren’t. If you can identify these tactics, you can teach your underperforming reps how to close more deals.
If you’re creating a pipeline report to measure team performance, you’ll want to focus on the most important performance-related KPIs. These include:
- Quota attainment
- Deal win rate
- ACV
- Sales forecast volume
- Sales cycle length
They help you accurately forecast your pipeline
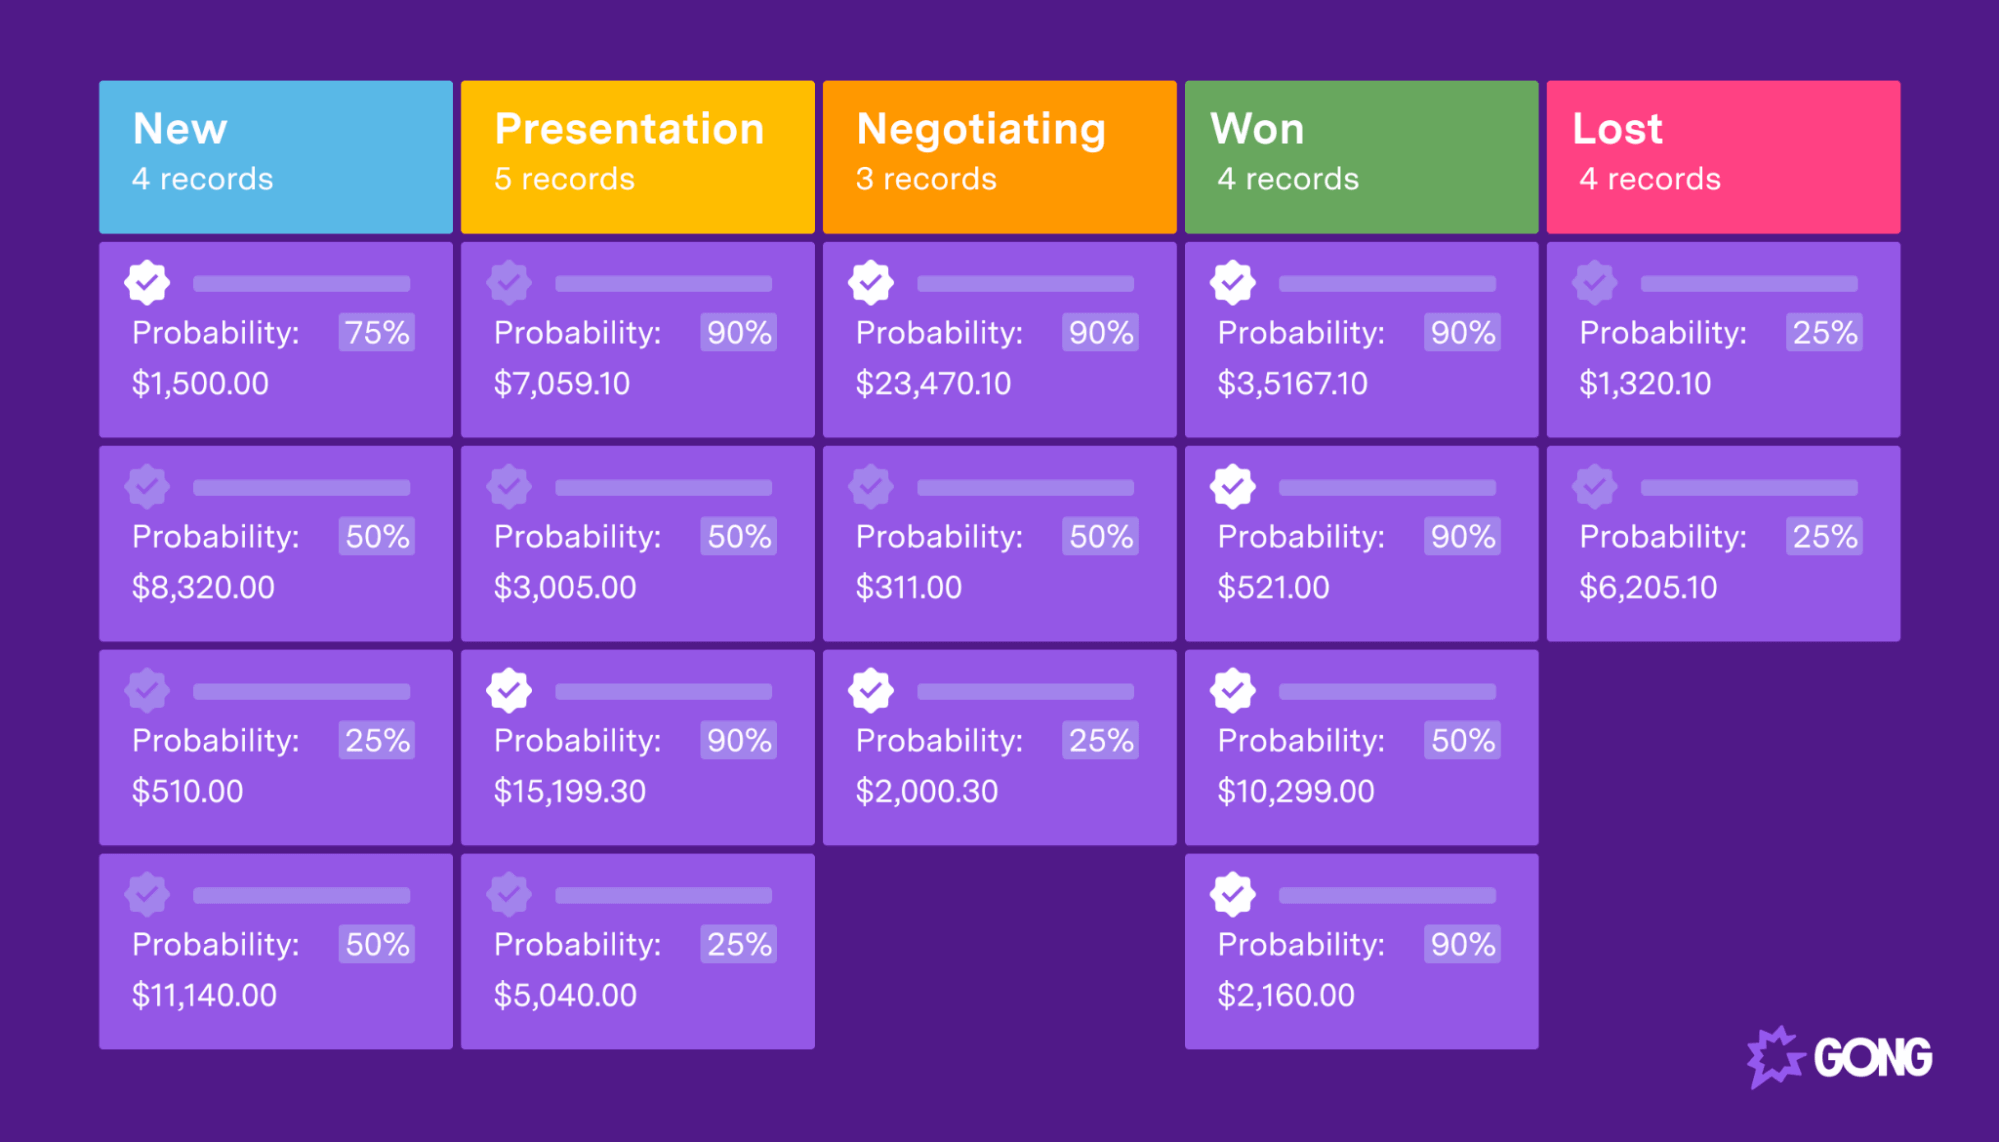
The pipeline-based sales forecast is probably the most commonly used method for creating sales projections. As you can see from the image below, you use the current value of deals in your pipeline — along with an estimate of how likely they are to close — to calculate future potential revenue.

It’s one of the best ways to build an accurate forecast because it’s purely based on the deals your team has in play right now. Historical data can be misleading, especially if you had a bumper period last quarter, but a report based on your current pipeline grounds everything in reality.
6 metrics to include in a pipeline report
There are dozens of metrics you can include in a pipeline report. Here are six of the most important KPIs you’ll want to include.
1. Total opportunities
Let’s start with the obvious: total opportunities. This metric is the total number of unclosed leads in your pipeline. Make sure you include every deal that doesn’t have a signed contract attached to it, including negotiated deals and deals where offers have been sent.
This is the guiding light of your sales report — the figure you should use to take everything else into account. It will also govern how you resource your sales team and how you set sales targets. For instance, if there are too many deals in your pipeline, you may want to think about hiring more sales staff. Or, if there are too few deals in your pipeline, you may want to raise quotas, increase the time reps spend prospecting, or look into further training for your sales reps.
2. Sum of opportunity amount
What’s the total value of your pipeline? That’s the question the sum of opportunity amount will answer. Calculating this metric is simply a case of adding up the potential value of all the deals in your pipeline.
Once you have a sum of opportunity amount, you can calculate your pipeline’s average deal size. Do this by dividing the sum of opportunity amount by the total number of deals in your pipeline. By calculating average deal size, you can check your sales growth and make sure your reps are targeting the right-sized deals.
3. Opportunity amount by stage
It’s important to understand how potential deals are distributed through your pipeline. That’s where opportunity amount by stage comes in handy. This metric breaks down the total value of the deals at each stage of your pipeline.
An opportunity amount by stage is easy to calculate. You simply add up the value of each deal for each pipeline stage (prospecting, outreach, negotiation, etc.).
Ideally, you want each stage of the pipeline to have a similar number of deals with a similar total value. But it may be that you have millions of dollars worth of deals stuck in the closing stage and very few deals at the start of your pipeline. That scenario would suggest that closing deals is a huge bottleneck for your reps, and you need to revisit your sales process to rectify the situation.

4. Opportunity amount per rep
This is another relatively straightforward metric. The opportunity amount per rep is simply the size of the deals divided by the number of sales reps in your team.
If you have a total pipeline opportunity of $2 million and five sales reps, you have an opportunity amount per rep of $400,000.
If you want to get really specific, you could calculate the opportunity amount for each of your reps. It may turn out that of that $2 million total opportunity amount, one rep has $1 million in the pipeline and the other four reps have $250,000 each.
5. Pipeline coverage per rep
Pipeline coverage is a comparison between your total pipeline opportunities and your target revenue. If you have $2 million in pipeline opportunities and $2 million in projected revenue, you have a pipeline coverage of 1x.
The pipeline coverage per rep, therefore, is a measure of each rep’s pipeline value compared to its target. As you may have already guessed, this is an incredibly effective way to see which reps should hit their sales goals, which reps are smashing their targets, and which reps are underperforming.
6. Meetings scheduled for this week or next
Meetings scheduled for this week or next is a great metric to track if you want to find out to what extent your pipeline is moving forward.
When one of your sales reps books a meeting or demo, that’s a strong sign that the deal is moving toward the closing stage or will close imminently.
But this metric also tracks your sales reps’ activity levels. Break it down on a rep-by-rep basis, and you can instantly see which reps are booking the most meetings. This is an easy way to not only spot your top performers but also find reps who need a little help closing deals.
Tailor your pipeline report to your audience and goals
No two pipeline reports are the same. The goals a good pipeline report can help you achieve and the potential metrics that you can include are so numerous that it’s easy to tailor a pipeline report to almost any scenario.
As such, it’s crucial to remember why you are creating a pipeline report and who you are creating it for before diving into the data. That’s because the metrics you include in a report you run to monitor your team’s performance will differ from those you use in a report you send to senior executives.
Let’s say you want to run a monthly pipeline report to understand your team’s performance. In this case, you’re going to be very interested in KPIs like pipeline coverage per rep and opportunity amount per rep and less interested in the total sum of opportunity amount.
If you’re creating a report for executives, however, top-level figures like total opportunities and total pipeline value are crucial. Brevity will also be important if you’re sending reports to executives who don’t have time to read long summaries.
Get a real-time view of your pipeline with Gong
Pipeline reports are powerful, but they take time and effort to create. That’s why savvy sales managers turn to sales software for help.
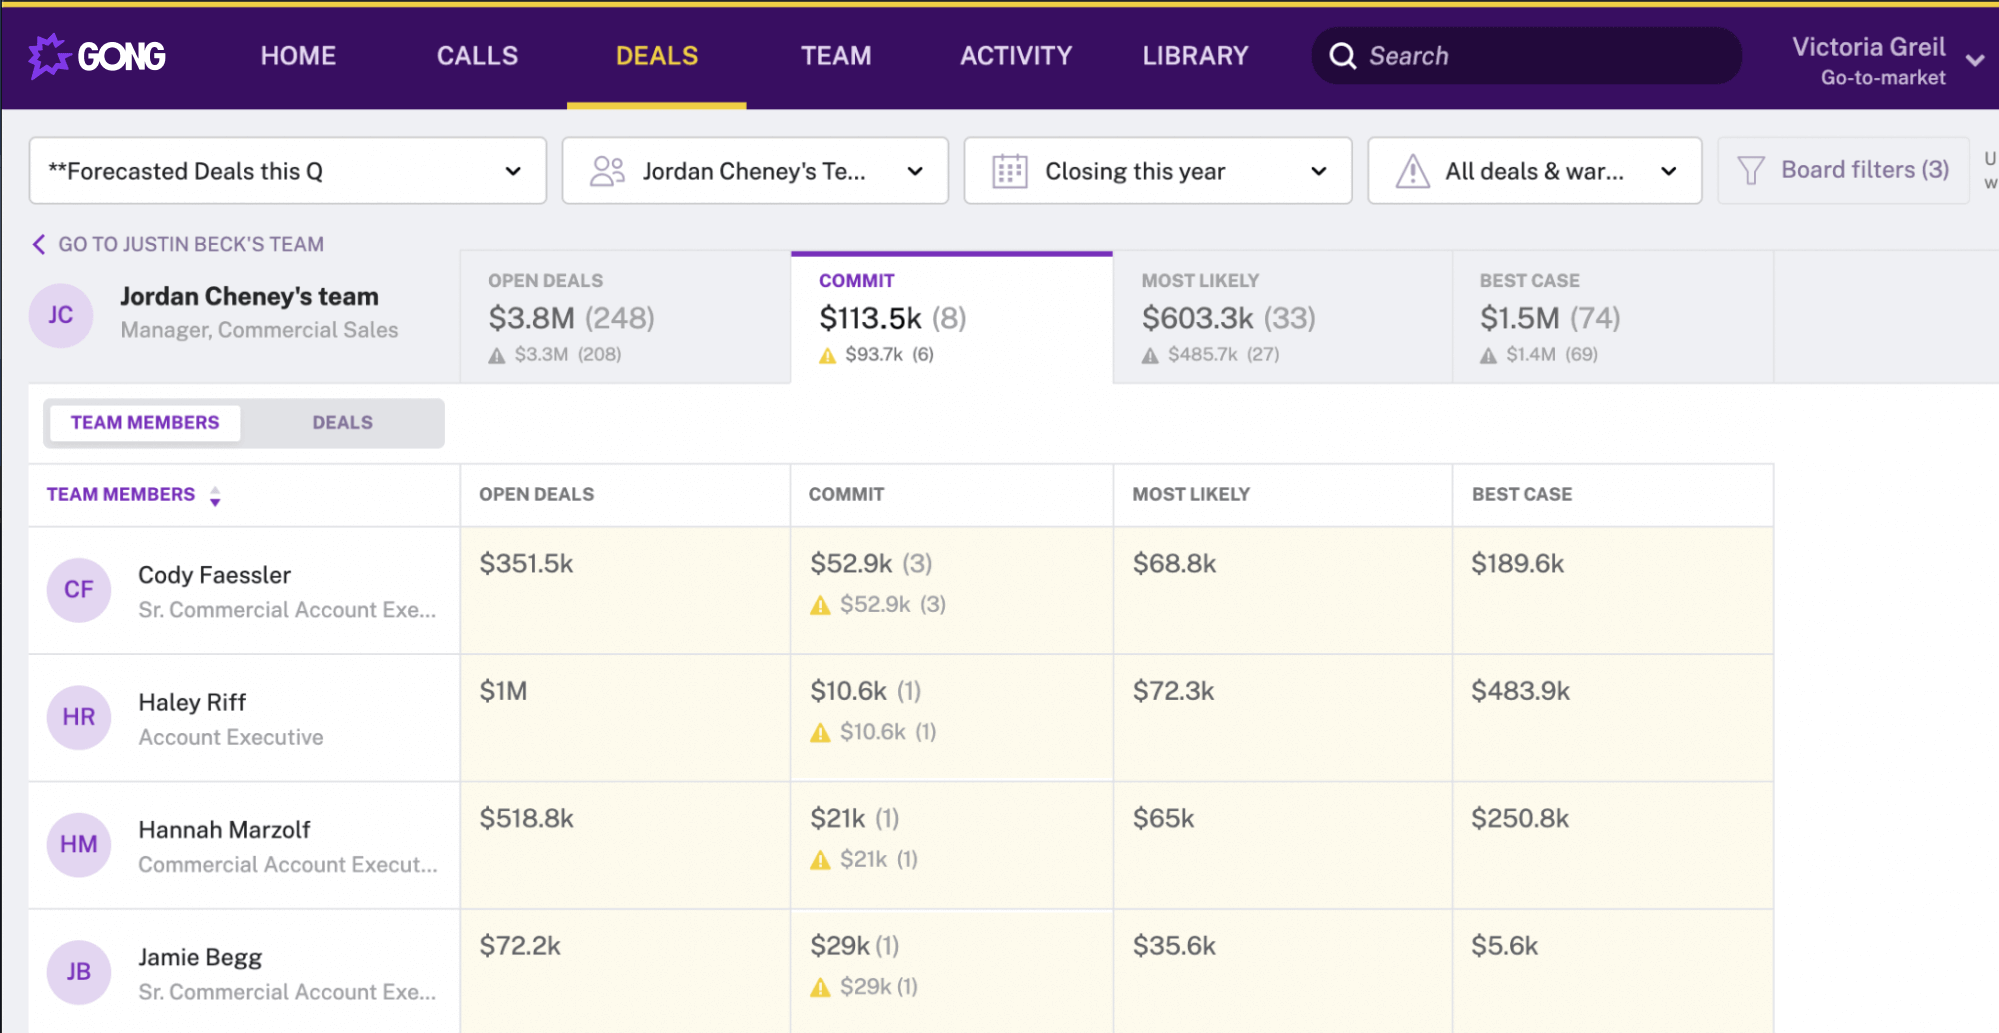
You can use Gong to get a real-time view of your sales pipeline. Our platform plugs into your CRM and captures and analyzes every bit of buyer data so that you can see in an instant what your pipeline looks like, how many deals are at each stage, and which deals are most at risk. Gong Assist even provides actionable advice to get those at-risk deals moving again. Book a demo today to find out more.
