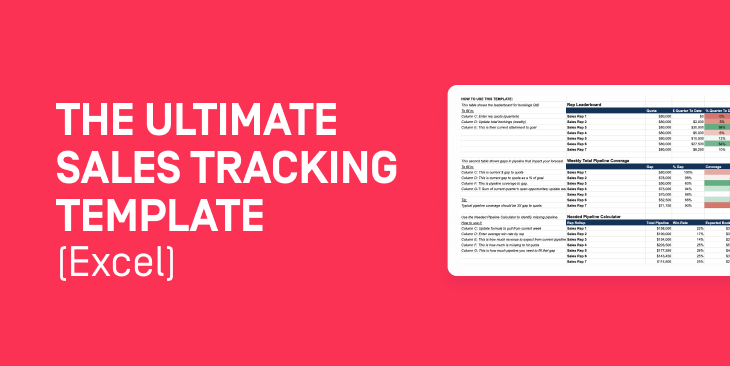
The ultimate sales tracking template (Excel)
- Next-level sales tracking
Use this sales tracker to get weekly insights into your team’s progress against must-track KPIs for weekly activity, pipeline, and forecasting. - Catch early indicators
Gaps in pipeline? Unworked accounts? Low activity? This sales tracking template will highlight problem areas before it’s too late. - Cut to the insights
The template comes with built-in excel formulas so you can skip the spreadsheet footwork and numbers juggling and see the reports
- Data entry
Share the spreadsheet with reps, have them enter weekly activity and pipeline data and the template does the work for you. - Automated tracking
Track key performance indicators for your organization, including activity metrics, pipeline tracker, and up-to-date leaderboards. - Includes instructions
Not sure how to use the sales tracking template? Both of these spreadsheets (the Excel and Google versions) come with instructions on how to use each report.
- Activity leaderboard snapshot
See which reps are doing the most when it comes to calls, emails, meetings, and accounts worked. - Meetings leaderboard
For relationship building, deal activity, and simply staying top of mind, your reps need to book weekly meetings. Now you can see exactly who’s doing just that. - who’s picking up the phone
It’s hard to sustain deal momentum without making phone calls. See weekly call activity broken down by week and by rep. - Account activity
If you’re wondering why certain deals are stalling, stagnating, or falling off the map, accounts worked per week and % accounts worked reports. - Emailers of the week
Make sure that reps are staying top of mind using email by verifying weekly email activity broken down by week and by rep. - Gaps in coverage
Improve the accuracy of your sales forecast by uncovering the critical gaps in pipeline (FYI, pipeline coverage should be three times gap to quota). - Where the bookings at
Bookings are such an important pipeline metric. For this report, type in rep quota and total weekly bookings to see how close each rep is to meeting their weekly goals. - Needed pipeline
The Needed Pipeline Calculator will help you closely identify pipeline needs by showing you a breakdown based on Win-Rate, Expected Bookings, and Expected Gap, and Pipeline Need.
- Activity tracker
Use this sales tracking template to keep track of rep activity like calls, emails, meetings booked, accounts worked on a weekly basis. - Pipeline tracking
Track pipeline week over week with detailed views of pipeline coverage, gaps, and needed pipeline to quota. - Rep leaderboard
Generate an automated report to track reps week over week and coach average performers to help them reach the top of their game.
FAQ
This spreadsheet is designed specifically for B2B sales managers and revenue leaders.
After you decide to get the template, you’ll have the option to download the sales tracking template in either Google Spreadsheet or Microsoft Excel format.
No, you don’t. The template only requires data entry: the reports will automatically pull from the right sections using built-in excel formulas.
Too often, sales managers and revenue pros take high-level reporting metrics and infer the insights. The beauty of this template is that it relies on specific intelligence, such as who is doing what on a weekly basis, where the actual gaps in pipeline are, and which reps need to step up so the team hits its number.
Check out this stat from one of our recent reports: 29% of leaders think their forecasting generates accurate results. Not good enough—not by a longshot! This sales report template includes an entire tab dedicated to Pipeline, including Rep Leaderboard, Weekly Total Pipeline Coverage, and Needed Pipeline Calculator, to help you take opinions out of your forecast. For more tips, check out How To Unlock Predictable Growth With Reality-Based Forecasting.

FREE EXCEL: GET THE SALES TRACKING TEMPLATE
Download the sales tracker spreadsheet and get the insights your team needs.