Revenue operations
7 actionable sales report examples you can use to enhance your reporting strategy

Jonathan Costet
Content Author
Published on: November 18, 2022
A sales manager without sales reports is like an explorer without a map. It’s hard to understand where you’ve come from or where to go next.
While sales reports may seem like another task on your never-ending list of things to do as a sales manager, they offer amazing insights into your sales teams and processes.
For instance, a great sales report can help you understand what went wrong last month, how much revenue your team should generate in the next quarter, and which reps outperform others.
They don’t have to be a chore to create, either. If you know which reports are valuable to you and have a sales report template, creating them should only take up a small amount of your time each week, month, and quarter.
To make things easier, we’ve compiled seven of the most actionable types of sales reports in this article.
What is a sales report?
A sales report is a document that analyzes various sales activities over a specific period of time. Each report will have a different purpose and include several key sales KPIs.
Sales reports offer many benefits. They help you:
- Understand sales activity:Creating regular sales reports is one of the easiest ways to understand what your reps are doing day-to-day and measure their sales efforts.
- Create transparency and accountability among sales reps:You need to understand who your top performers are, and reps also need to know where they stand among colleagues.
- Identify areas to improve:Do deals get held up at a certain point in the pipeline? Are some reps slower than others at closing deals? Sales reports can highlight these kinds of issues and many more.
- Improve forecasting:The more data you collect about your reps and pipeline, the more accurate your revenue forecasts will be.
Because different reports analyze different parts of your sales operation, it’s important not to rely on just one or two sales reports. You need to run several sales reports to keep track of everything.
7 sales report examples
You can create dozens of sales reports, each with a different sales goal and target audience. But which are the most powerful?
Here are seven example sales reports we recommend you run.
Periodic sales reports
A periodic sales report analyzes sales activity over a specific time. For instance, you can have a daily sales report template or run a weekly sales report, or a monthly sales report. Typically, these kinds of reports will be used exclusively by managers to understand the health of their team and pipeline.
Periodic sales reports are a general overview of your team’s performance, and as such, they should track a broad range of KPIs and key metrics. For reports that assess the health of your sales funnel, you should include the following KPIs:
- Deals won
- Deals lost
- Revenue
- Conversion rate
You should run pipeline-based periodic reports over a longer period, like a month or a quarter. That gives you enough time to collect actionable data and means the data you collect is more likely to represent an accurate picture of your sales activity. After all, it’s easy for one big deal to throw off a weekly report.
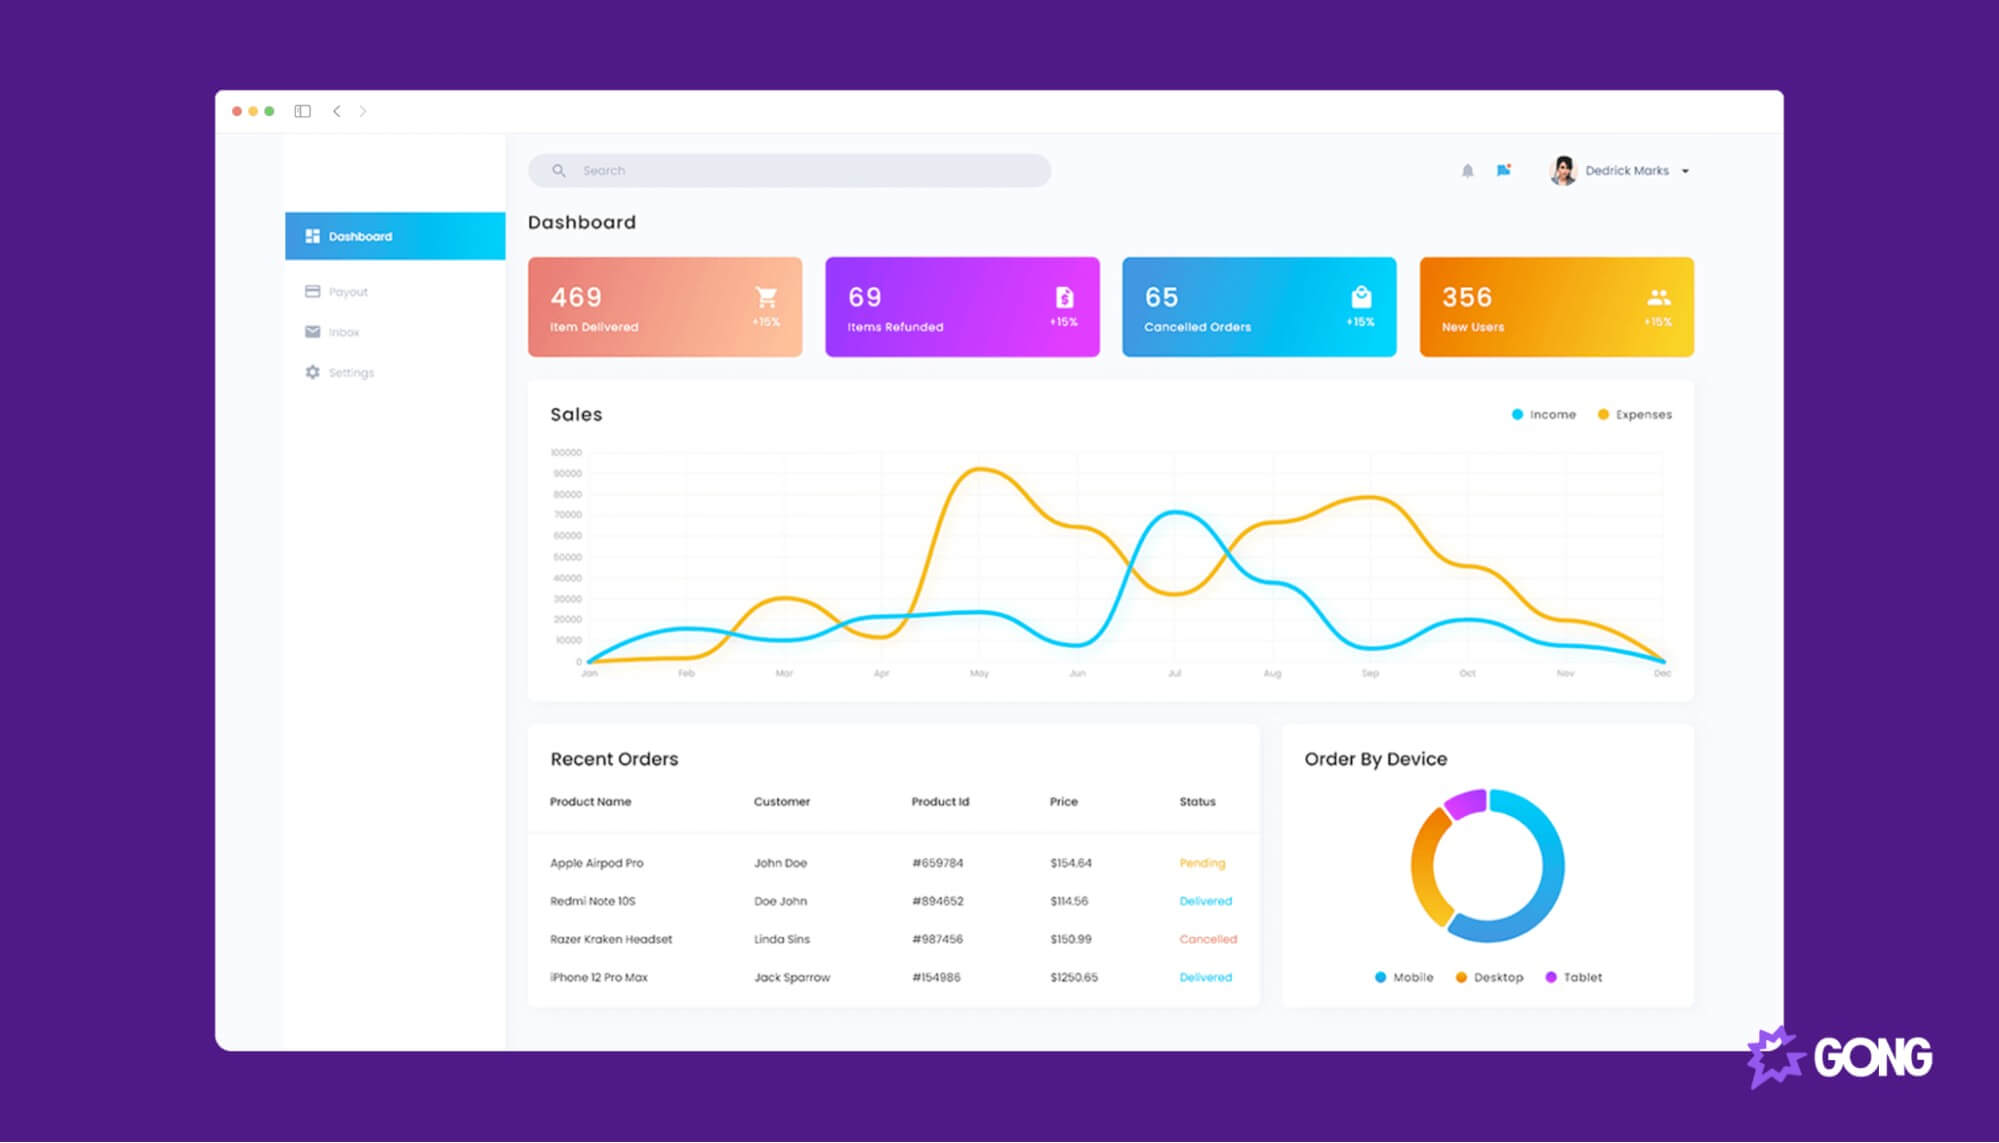
You can also use periodic reports to analyze rep activity, productivity, and performance. Daily and weekly reports are ideal for tracking rep activity and should look at the following KPIs:
- Number of outbound calls made
- Number of meetings booked
- Number of sales made
Want to go even further? Use these 13 KPIs in your periodic sales report to measure team performance.
Forecasted sales report
Did your team’s performance live up to expectations? A forecasted sales report analyzes whether your team generated the amount of revenue you expected them to over a given period.
While sales forecasting is an estimation of your team’s future performance, a forecasted sales report is an analysis of their actual performance and can tell you a lot about the state of your sales pipeline.
For instance, a forecasted sales report can highlight reps who aren’t meeting their quotas. It can also identify deals in your pipeline that you need to prioritize.
A forecasted sales report also analyzes the accuracy of your forecasting . If you are consistently generating the amount of revenue predicted, great. But if you feel your entire team is working effectively, and you’re still not hitting forecasted targets, maybe there’s a problem with your data sources or forecasting approach.
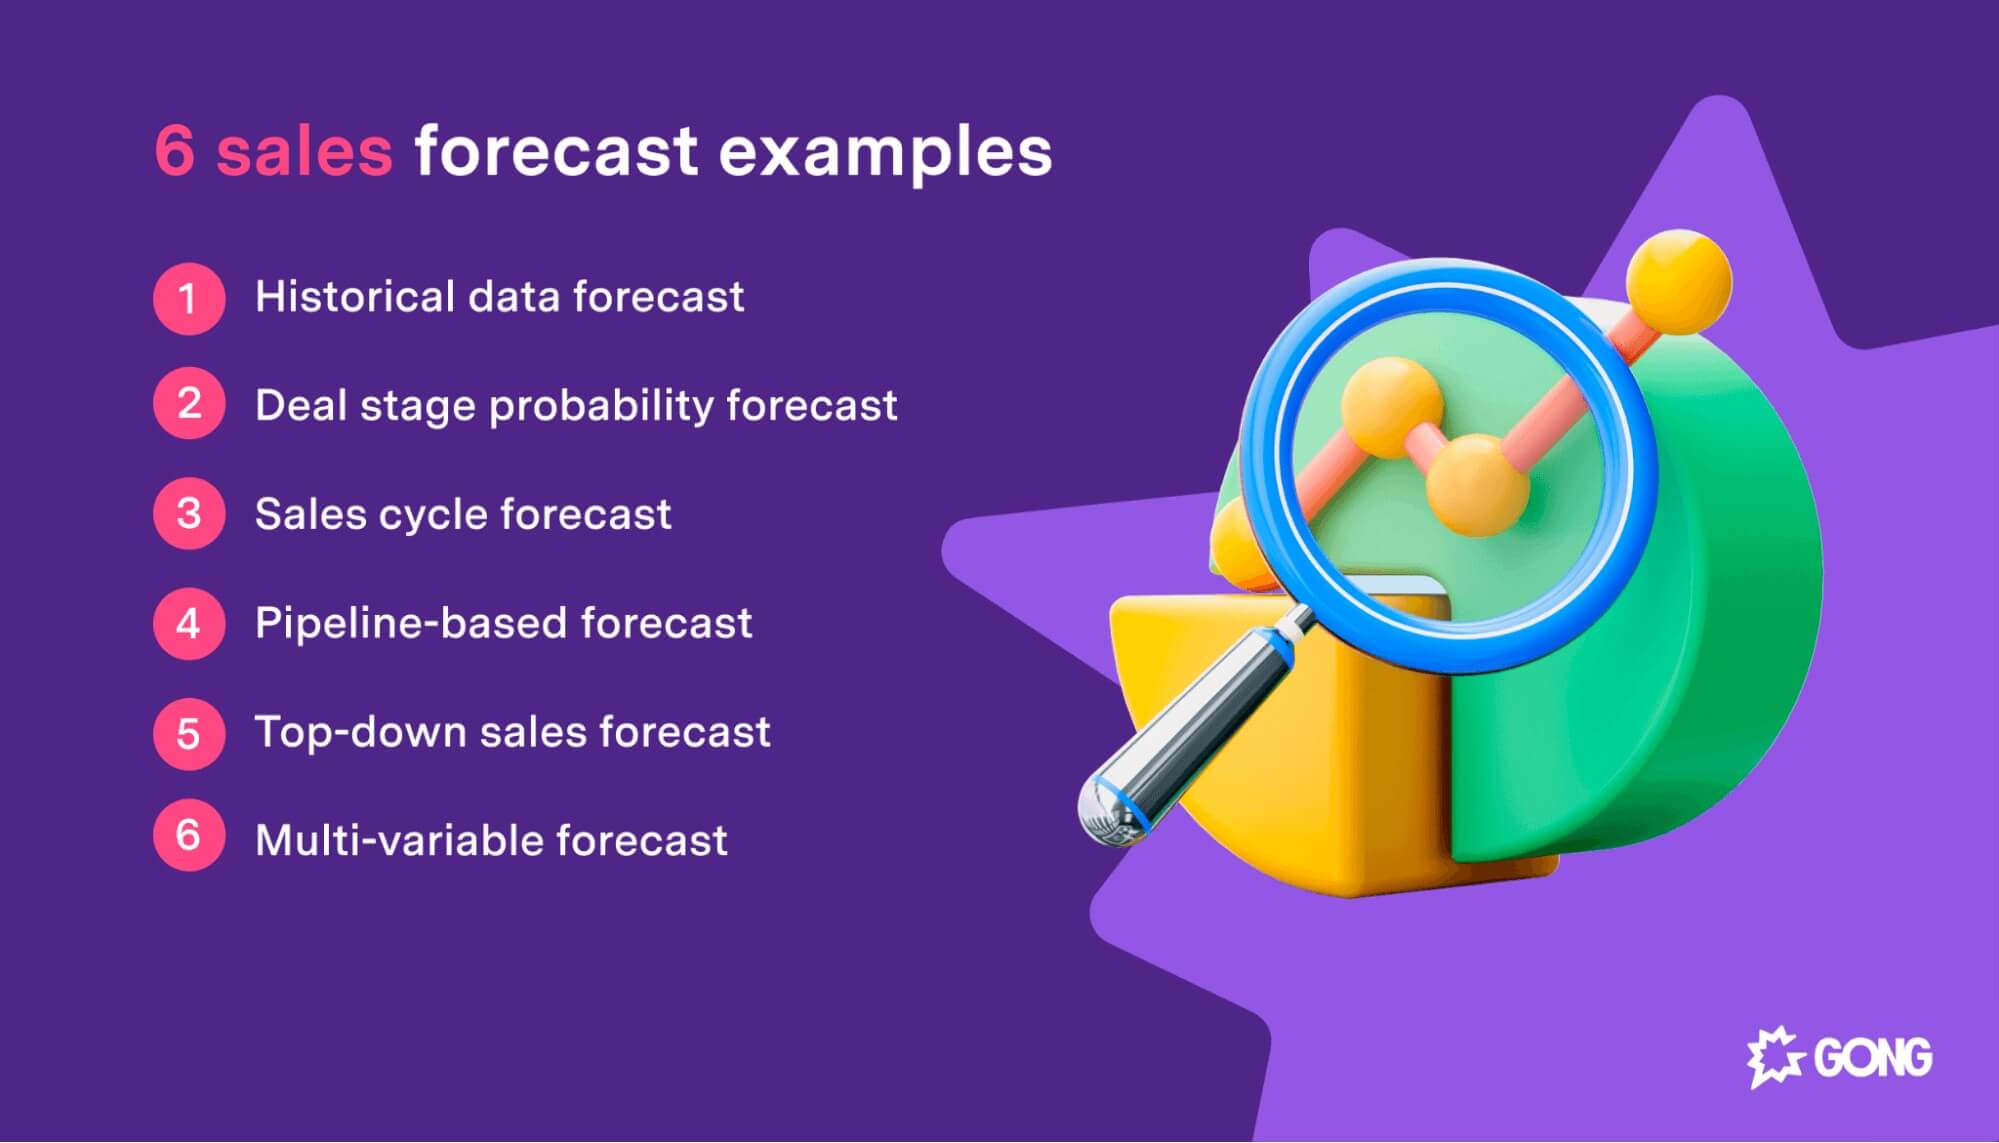
One strategy could be to use a different method of forecasting . There are six ways sales leaders can forecast sales:
- Historical data forecasts
- Deal stage probability forecasts
- Sales cycle forecast
- Pipeline-based forecast
- Top-down sales forecast
- Multi-variable forecast
If one method isn’t working, try another that may be better suited to your organization. You can also involve your sales reps in forecasting to make it more accurate. This is particularly powerful if you are using pipeline-based forecasting.
Use our free sales forecast template to get started with forecasting.
Sales rep performance report
A sales rep performance report drills into your reps’ activities and outcomes. It helps you analyze your reps’ performances over a given time period, like a week, month or quarter.
There are plenty of reasons to run regular sales rep performance reports. First, it helps you find your most productive and effective reps (note: these may not be the same people) and identify what they are doing differently.
Second, you can these reports with your sales department to help them understand how they perform compared to their peers. If reps aren’t tracking their sales activities, they probably don’t know how many calls they are making or what their conversion rates are.
Giving them access to this data and showing where they stand in your team is a great way to increase accountability.
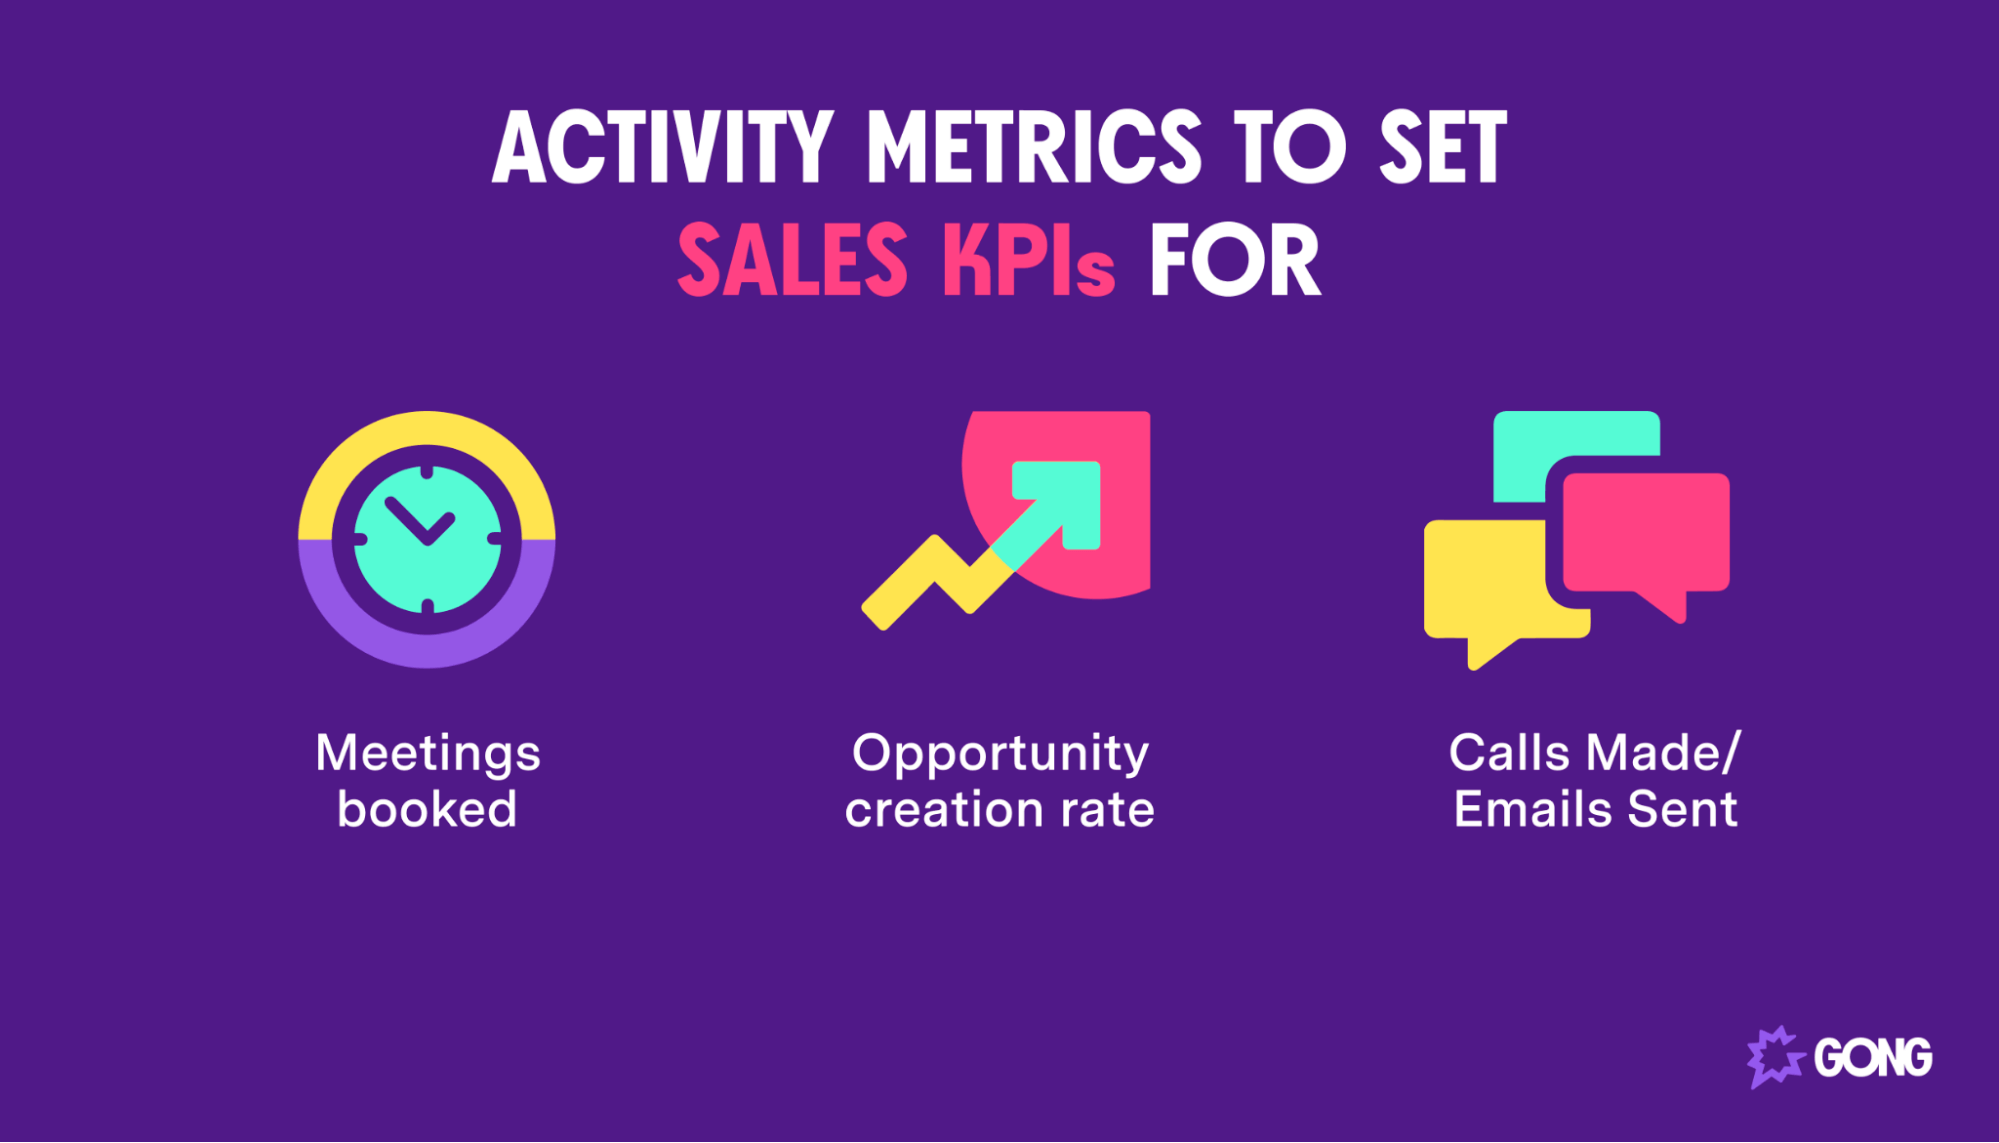
Here are some of the key KPIs to include:
- Calls made
- Emails sent
- Meetings booked
- Opportunity creation rate
You can also go deeper on each key metric, like tracking the duration of each cold call.
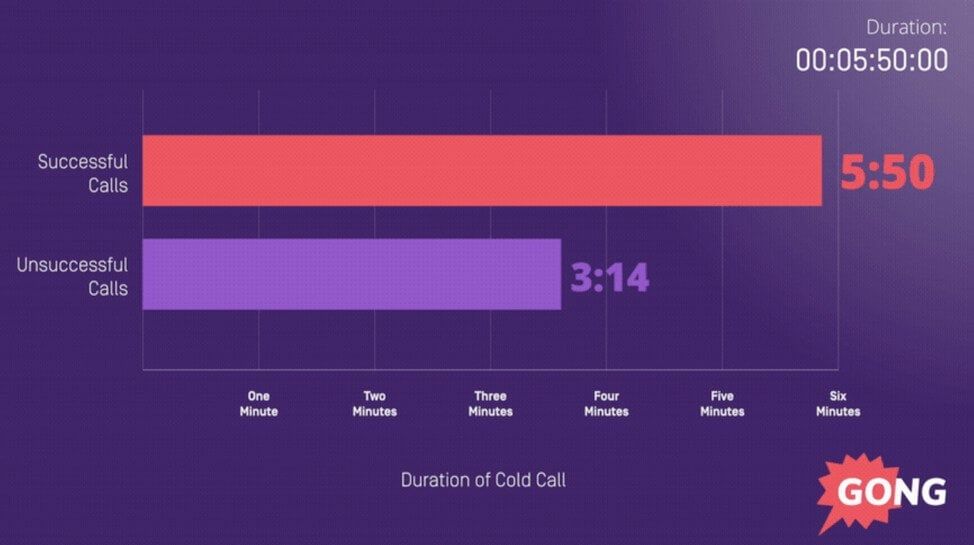
Why would you want to do that?
Our research shows successful cold calls are nearly twice as long as unsuccessful ones. If your most productive reps have longer conversations, you want to encourage other reps to stay on the phone for longer.
Conversion report
A lead conversion report measures the conversion rate of reps at each stage of your sales pipeline.
It’s a simple calculation. For each pipeline stage, divide the total number of deals converted to the next stage by the total number of deals at that current stage.
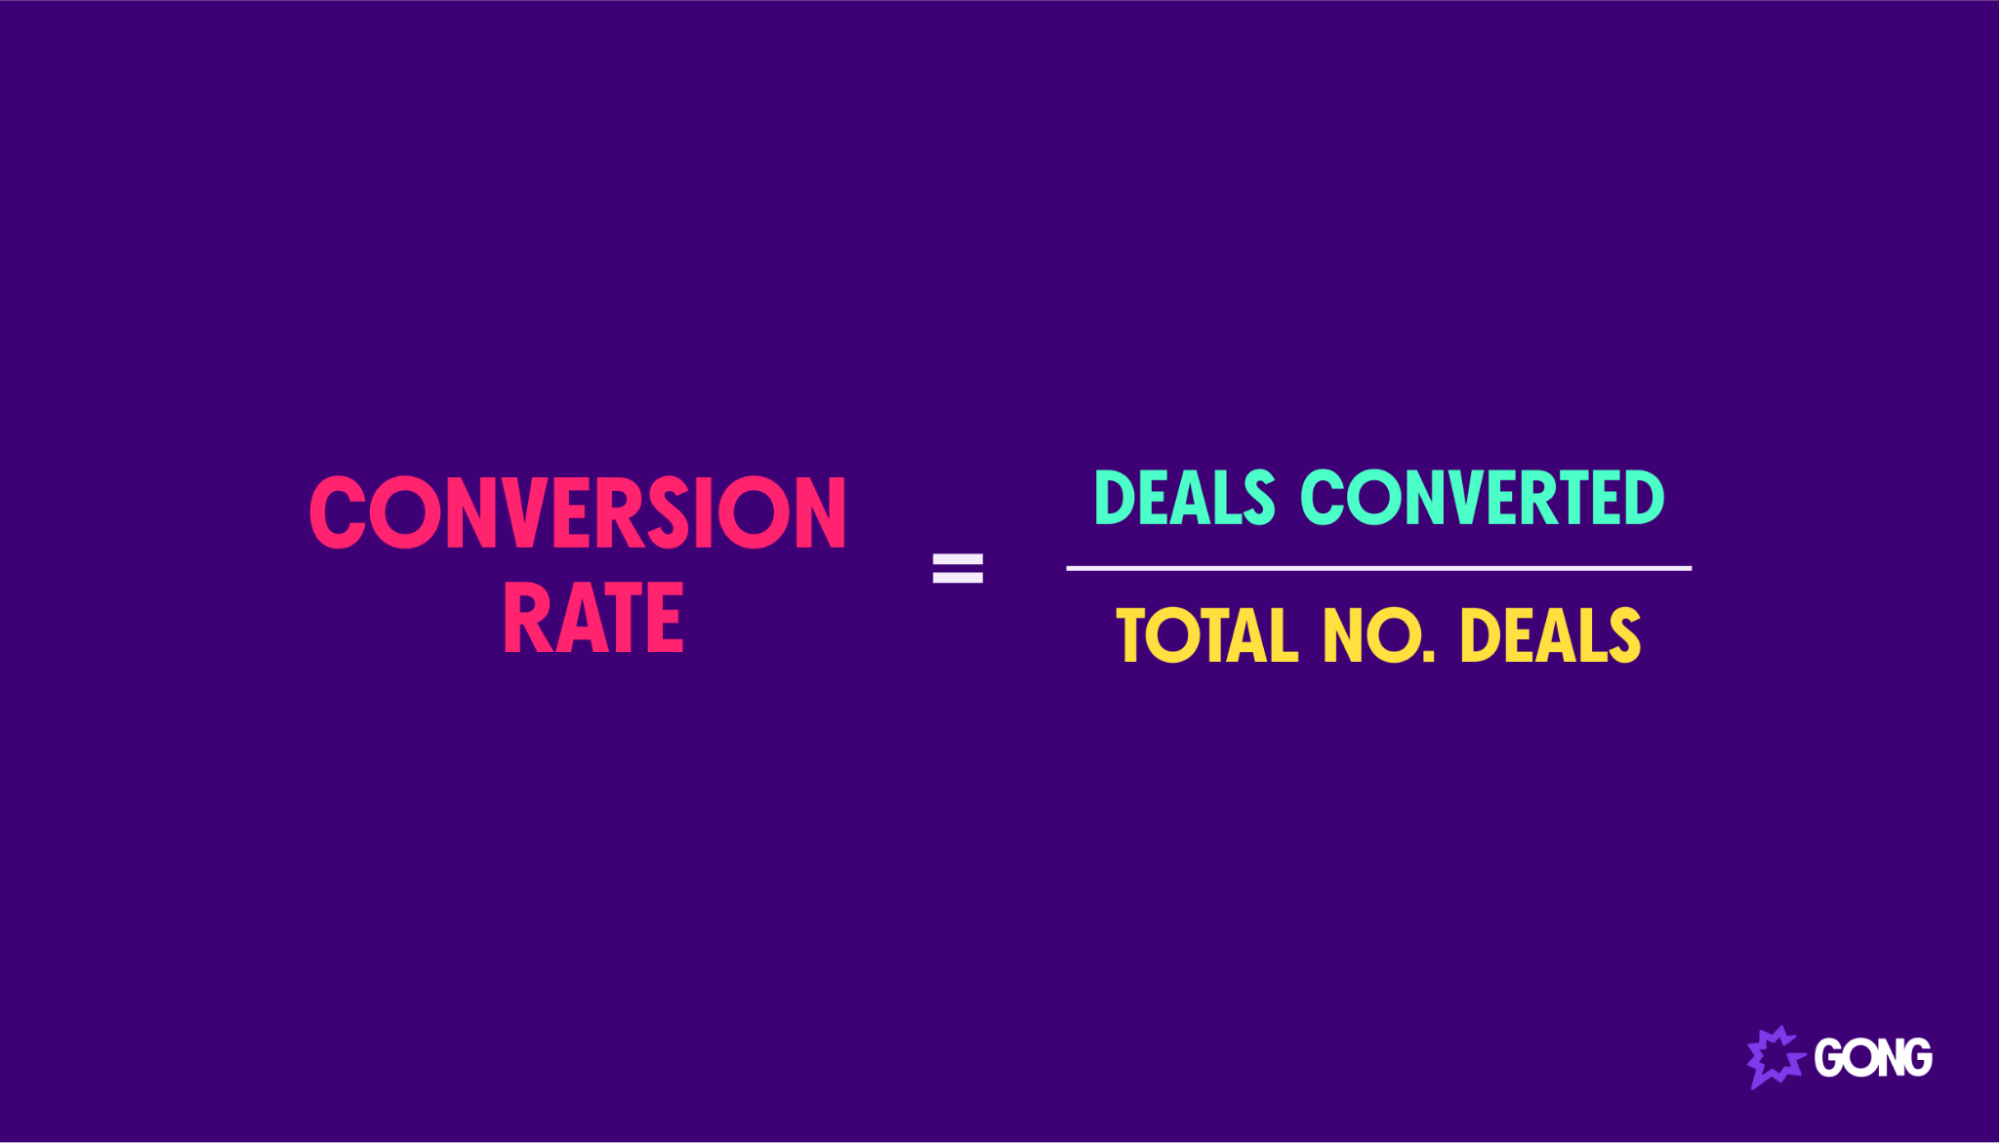
For example, if your team converted five deals from prospecting to negotiation and there were 10 deals in the prospecting stage of your pipeline, your team has a conversion rate of 50%.
Use a conversion report to identify the weakest points of your pipeline. You should be particularly concerned about losing deals late in the process. Reps should be closing a high percentage of sales that get this far. If they aren’t, it could be a sign that they aren’t qualifying prospects well enough earlier in the process or that your sales strategy isn’t working.
You can also use a conversion report to analyze rep performance. If one of your reps struggles to hit their quota, you can use a conversion report to see which pipeline stage they have the biggest issues with.
You may go even further and use conversion reports to divide sales tasks among your team. Find reps who are better at sales prospecting and creating opportunities and have them focus solely on that, while reps who are better closers can handle negotiations.
Average sales cycle length report
An average sales cycle length report measures the time it takes for reps to close each deal. It’s a simple metric and report, but it can tell you a lot about the state of your sales cycle and your reps’ performances.
Calculating the average length of your sales cycle is easy. Divide the total number of days it takes for all deals to be completed by the total number of deals you’ve completed.
So if it’s taken 1000 days to close the deals you completed last month, and you closed 10 in total, your average sales cycle length is 100 days (1000/10 = 100).
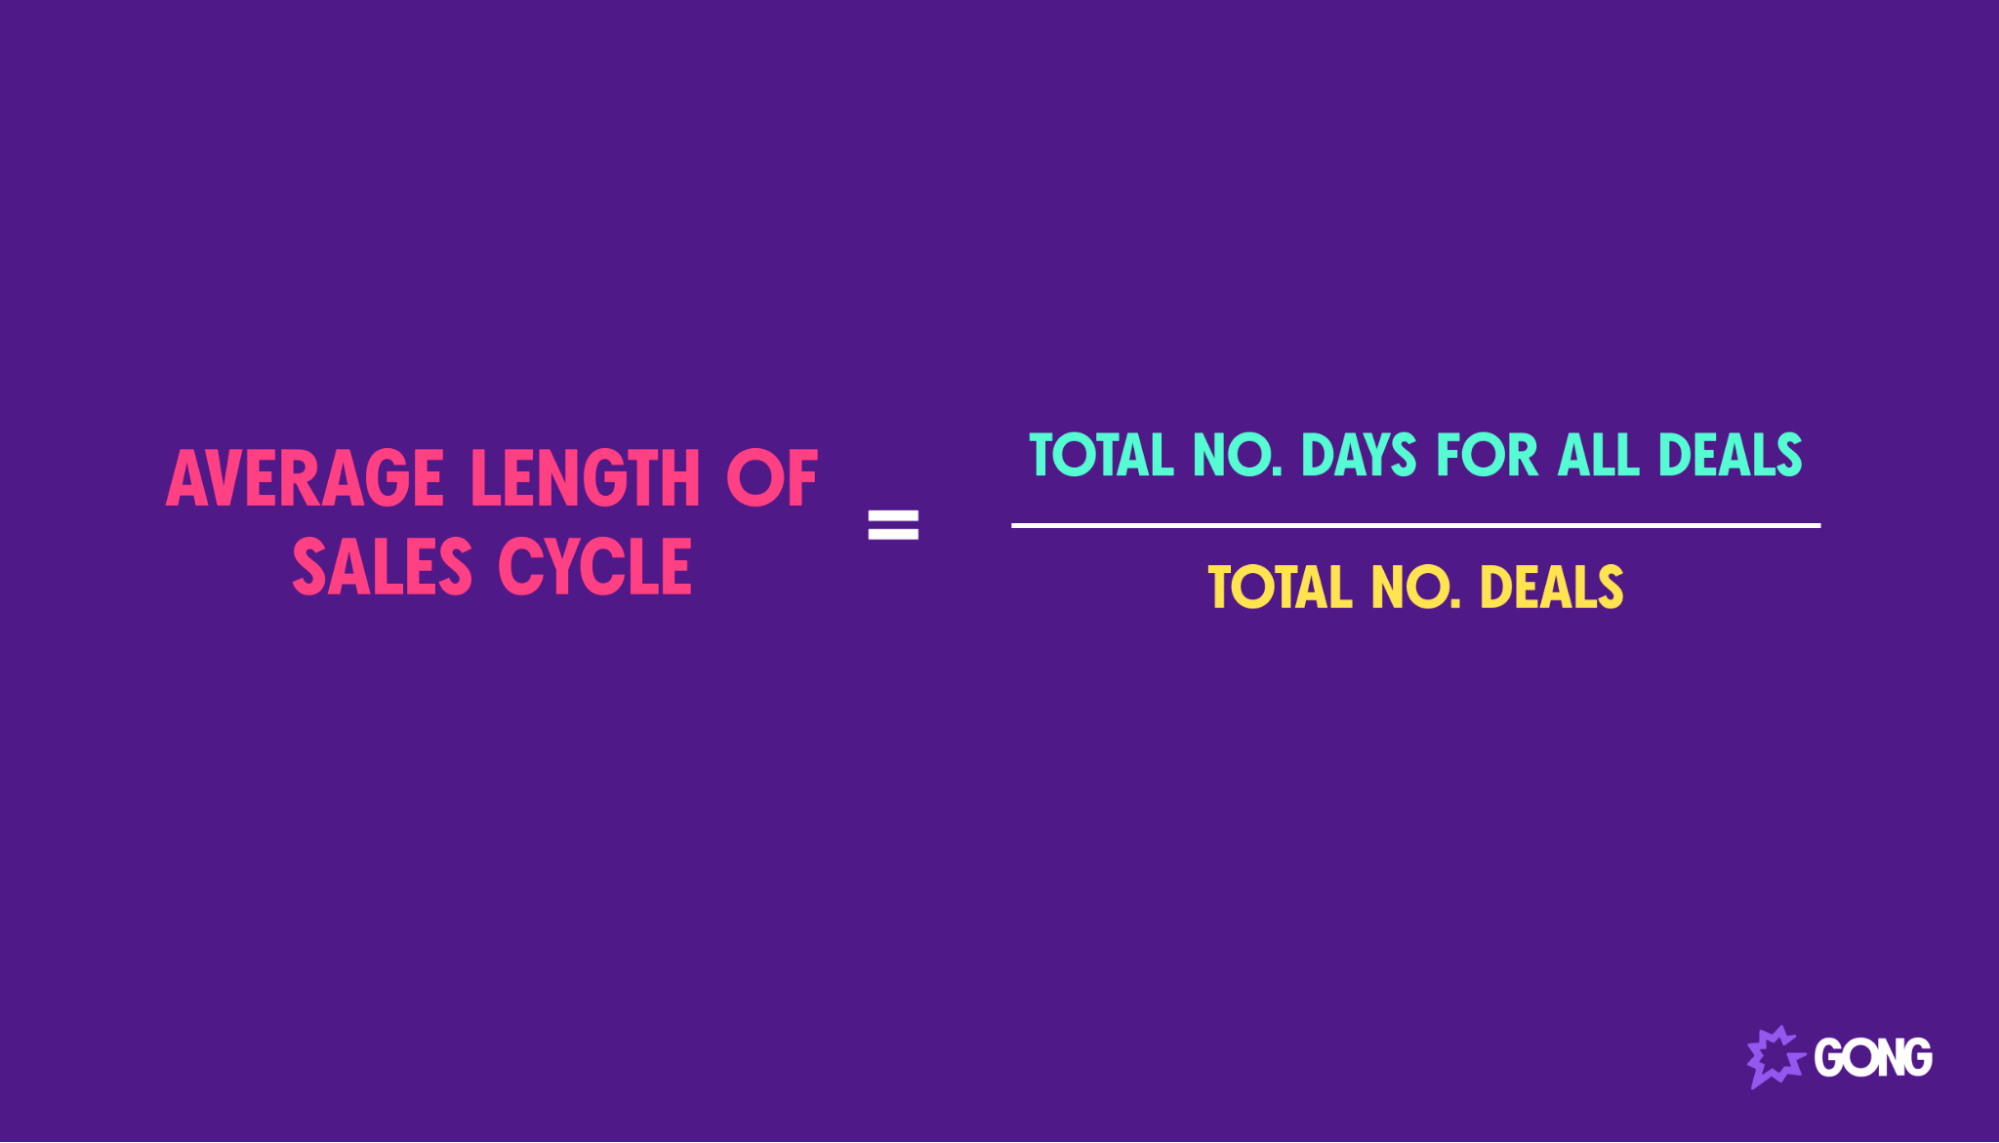
Run this report for your sales team as a whole to establish a benchmark metric. Then, you can use that benchmark to analyze the sales performance of individual reps.
Naturally, some reps will perform above average and boast much shorter sales cycles. Other reps will struggle to keep pace.
It may be the case that some reps are simply better sellers than others. But maybe they are using different sales methodologies that let them close deals faster. If that’s the case, then it’s your job to identify what those are and help slower reps adopt them to keep up.
This is another report that you should with your team. Your reps may not know how long it takes them to close deals on average or where they rank in your team. Sales reps tend to be competitive, so making them aware of the data may be enough to speed up your sales cycle.
Deals won and lost report (aka win/loss analysis)
Deals won and lost report, also known as a win/loss analysis, looks at why deals convert or fail. It helps you see why you win the contracts you do and analyze why sales were lost so you can avoid similar issues again in the future.
A win/loss sales analysis report can tell you as much about your product as it can about your sales process. For instance, you may have a feature that prospects love or a particular pain point your problem solves. Maybe the price is a huge hurdle reps have to overcome. These insights can be as valuable for product and marketing teams as they can for your sales team.
It’s important to note that this report uses far more qualitative data than others in this list. As a result, you may need to encourage reps to leave a note about why each deal was won or lost in your CRM.
You can jump-start on that qualitative data by downloading our free guide to the 5 Deal Warnings Preventing You From Closing Revenue .
Sales pipeline report
Do you know exactly what your sales pipeline looks like at any moment? If not, you need to be creating regular sales pipeline reports.
A sales pipeline report analyzes the current state of your team’s deals, letting you know where deals are in the pipeline, which deals are most likely to convert, and which are in jeopardy.
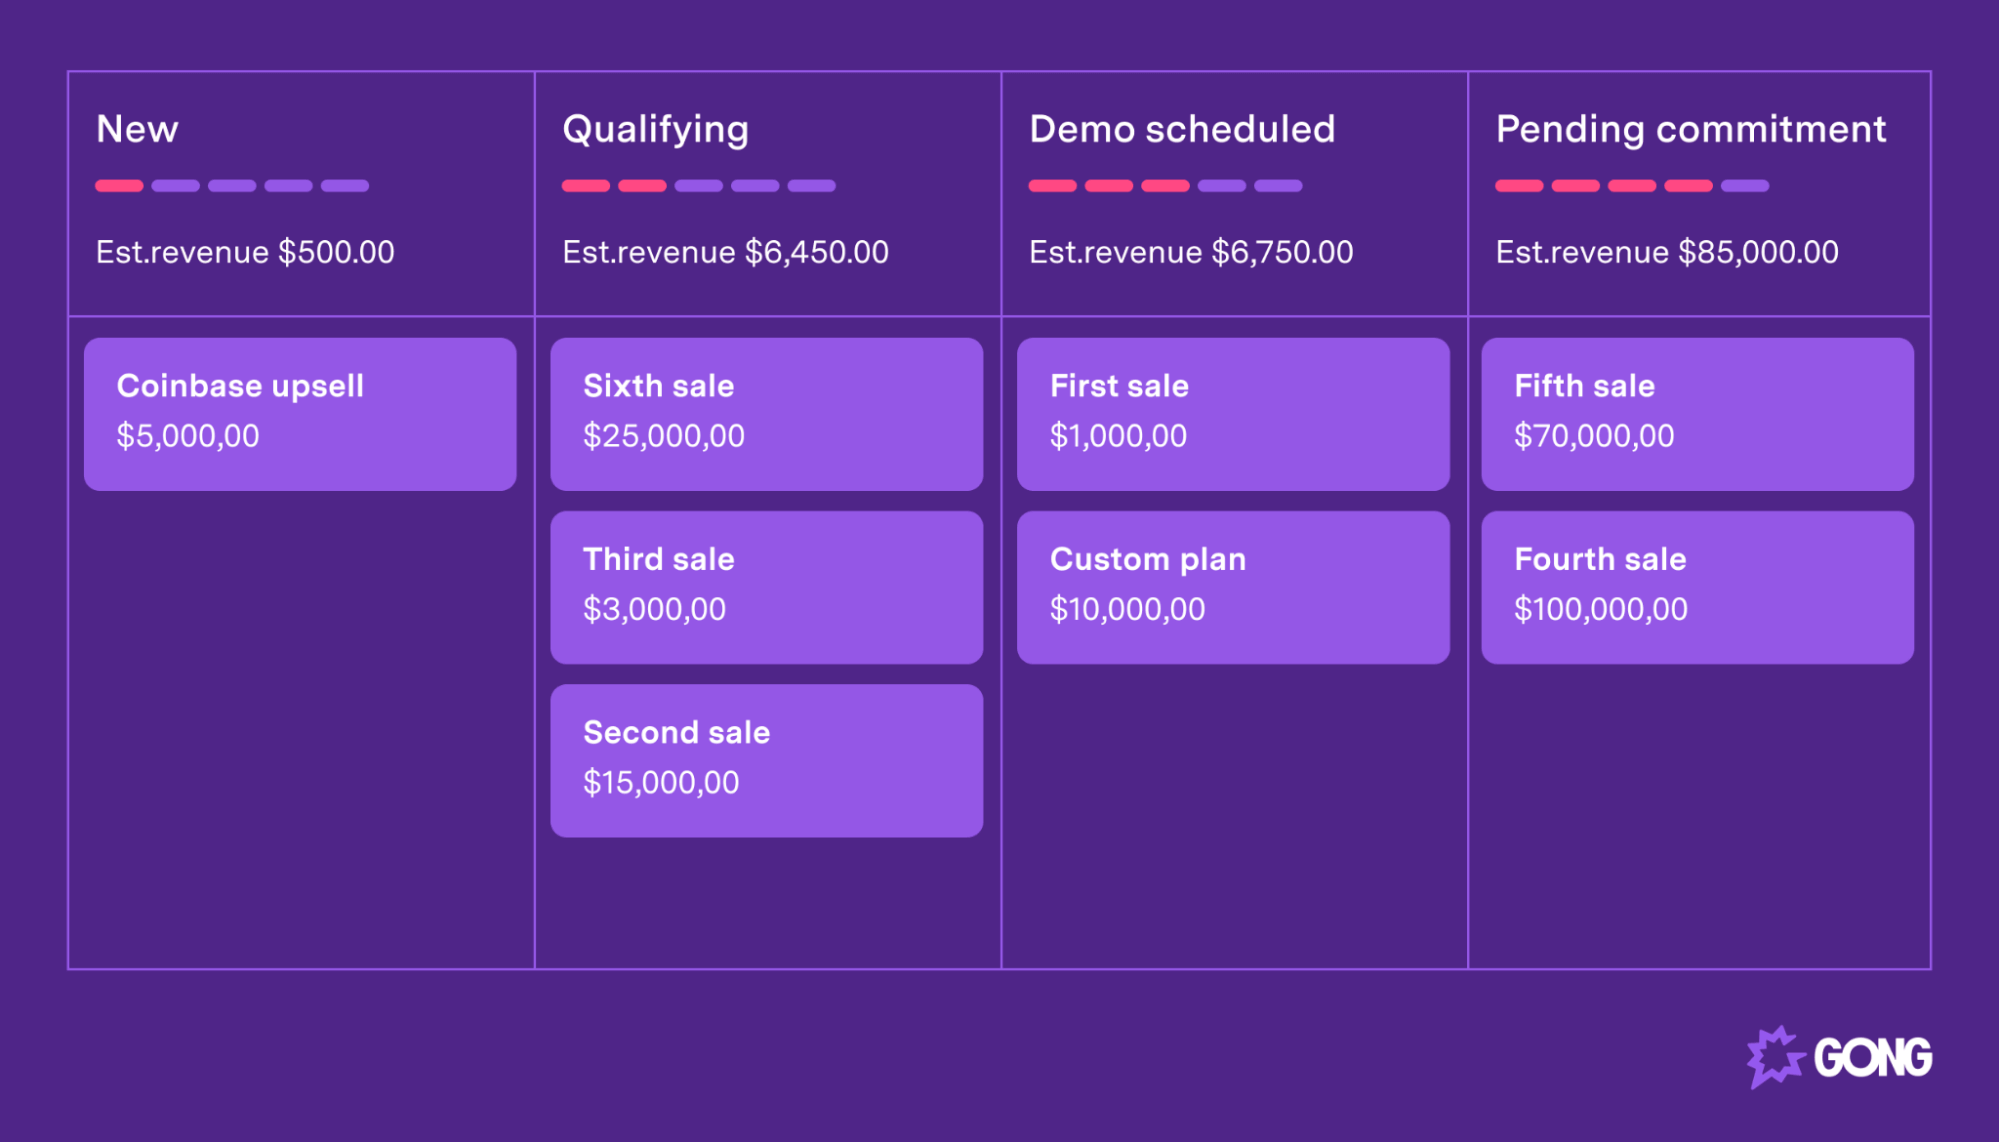
The example sales report below shows what a sales pipeline report should look like. For each deal, you can see its value, its status, and the probability the deal will close. It’s an excellent overview to show stakeholders the health of your pipeline.
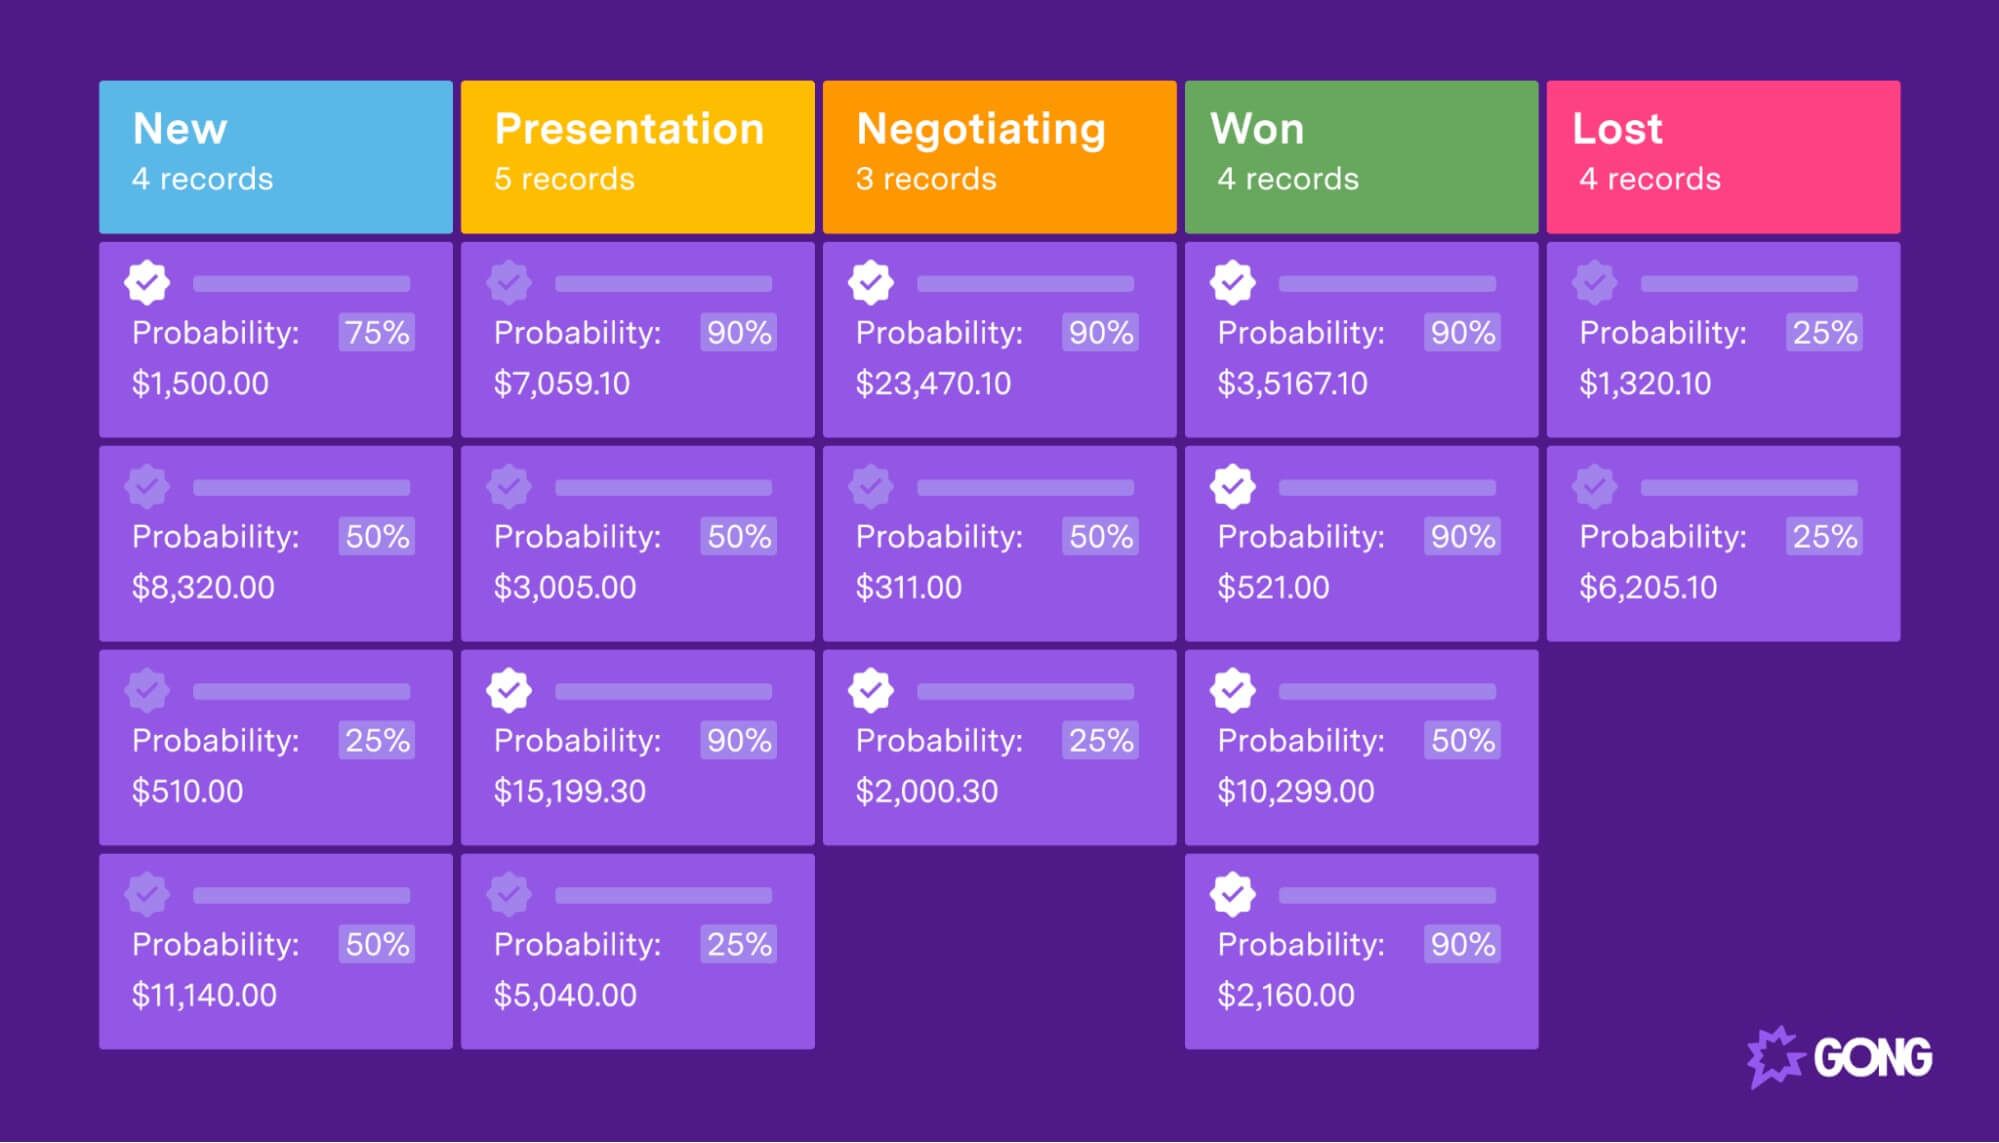
But you can also use an in-depth sales pipeline report to make it easier to predict and forecast future sales revenue. It will also empower you to provide the support your sales reps need to get deals across the line. You may not be able to help with every deal, but you can lend your expertise to deals that need it most.
Get started faster with our free sales pipeline template .
Create killer sales performance reports with Gong
Sales reports are incredibly valuable, but they’re time-consuming to create — especially when gathering data. That’s why savvy sales managers use tools to automate the process as much as possible.
Gong tracks every facet of every deal and automatically gathers the data you need to create killer sales reports. In some cases, like sales forecasting, it can even replace a sales report completely.
Book a demo today to learn more about our sales reporting software .

Content Author
Jonathan Costet is the Senior Director of Revenue Marketing at Wiz. Before this, he was Senior Manager, Growth Marketing at Gong, where he played a crucial role in driving demand generation through data-driven strategies. At Gong, Jonathan harnessed the power of revenue intelligence to craft effective messaging, improve customer retention, and optimize sales forecasting. He was instrumental in using Gong's platform to unlock insights that helped target the right buyers and maximize marketing efficiency.
Discover more from Gong
Check out the latest product information, executive insights, and selling tips and tricks, all on the Gong blog.
